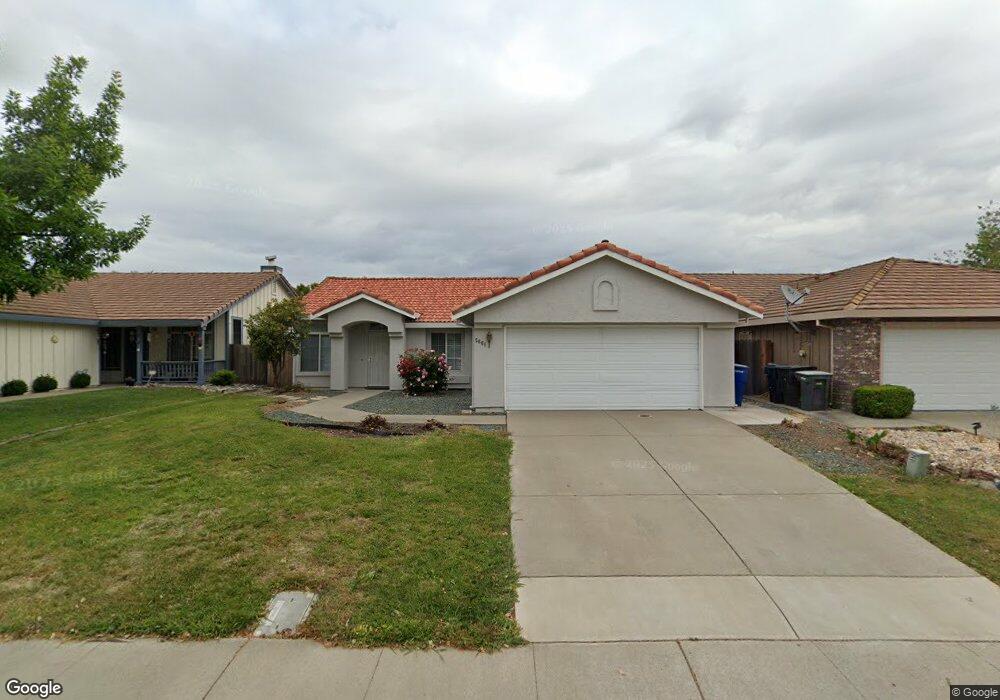
5661 Mapleton Way Sacramento, CA 95823
North Laguna NeighborhoodEstimated Value: $418,000 - $499,000
3
Beds
2
Baths
1,417
Sq Ft
$316/Sq Ft
Est. Value
About This Home
This home is located at 5661 Mapleton Way, Sacramento, CA 95823 and is currently estimated at $447,669, approximately $315 per square foot. 5661 Mapleton Way is a home located in Sacramento County with nearby schools including Barbara Comstock Morse Elementary School, Edward Harris Jr. Middle School, and Monterey Trail High School.
Ownership History
Date
Name
Owned For
Owner Type
Purchase Details
Closed on
Oct 11, 2011
Sold by
Yerby Joyce and Yiang Michael
Bought by
Choi Quan Zhen and Jiang Minyi
Current Estimated Value
Purchase Details
Closed on
Sep 29, 2004
Sold by
Yerby Joyce and Liang Joyce
Bought by
Yerby Joyce and Liang Michael
Purchase Details
Closed on
May 29, 1996
Sold by
Liang Wendy L
Bought by
Liang Joyce X
Home Financials for this Owner
Home Financials are based on the most recent Mortgage that was taken out on this home.
Original Mortgage
$99,000
Interest Rate
7.97%
Purchase Details
Closed on
Apr 12, 1994
Sold by
Sterling Springs Sacramento
Bought by
Liang Joyce X and Liang Wendy Y
Home Financials for this Owner
Home Financials are based on the most recent Mortgage that was taken out on this home.
Original Mortgage
$100,000
Interest Rate
8.35%
Create a Home Valuation Report for This Property
The Home Valuation Report is an in-depth analysis detailing your home's value as well as a comparison with similar homes in the area
Home Values in the Area
Average Home Value in this Area
Purchase History
| Date | Buyer | Sale Price | Title Company |
|---|---|---|---|
| Choi Quan Zhen | $143,000 | Placer Title Company | |
| Yerby Joyce | -- | Placer Title Company | |
| Liang Michael | -- | Placer Title Company | |
| Yerby Joyce | -- | -- | |
| Liang Joyce X | -- | -- | |
| Liang Joyce X | $128,000 | First American Title Ins Co |
Source: Public Records
Mortgage History
| Date | Status | Borrower | Loan Amount |
|---|---|---|---|
| Previous Owner | Liang Joyce X | $99,000 | |
| Previous Owner | Liang Joyce X | $100,000 |
Source: Public Records
Tax History
| Year | Tax Paid | Tax Assessment Tax Assessment Total Assessment is a certain percentage of the fair market value that is determined by local assessors to be the total taxable value of land and additions on the property. | Land | Improvement |
|---|---|---|---|---|
| 2025 | $2,303 | $179,605 | $56,518 | $123,087 |
| 2024 | $2,303 | $176,084 | $55,410 | $120,674 |
| 2023 | $2,239 | $172,632 | $54,324 | $118,308 |
| 2022 | $2,214 | $169,248 | $53,259 | $115,989 |
| 2021 | $2,178 | $165,930 | $52,215 | $113,715 |
| 2020 | $2,143 | $164,229 | $51,680 | $112,549 |
| 2019 | $2,105 | $161,010 | $50,667 | $110,343 |
| 2018 | $2,050 | $157,854 | $49,674 | $108,180 |
| 2017 | $2,009 | $154,759 | $48,700 | $106,059 |
| 2016 | $1,925 | $151,726 | $47,746 | $103,980 |
| 2015 | $1,884 | $149,448 | $47,029 | $102,419 |
| 2014 | $1,848 | $146,521 | $46,108 | $100,413 |
Source: Public Records
Map
Nearby Homes
- 5912 Sawyer Cir
- 5481 Muskingham Way
- 5267 Jacinto Ave
- 8420 Sunblaze Way
- 8504 Sunnybrae Dr
- 1312 Winterhart St
- 197 Cinema St
- 251 Cinema St
- 6024 Deepdale Way
- 5012 Wuthering Ave
- 6400 Sunnyfield Way
- 6401 Ventris Walk
- 6417 Ventris Walk
- 6433 Ventris Walk
- 8655 Starburst Way
- 6441 Ventris Walk
- 6449 Ventris Walk
- 6419 Jacinto Ave
- 6435 Jacinto Way
- 6443 Jacinto Way
- 5641 Mapleton Way
- 5681 Mapleton Way
- 5660 Dutton Way
- 5621 Mapleton Way
- 5640 Dutton Way
- 5680 Dutton Way
- 5660 Mapleton Way
- 5620 Dutton Way
- 5640 Mapleton Way
- 5680 Mapleton Way
- 5601 Mapleton Way
- 5620 Mapleton Way
- 8541 Montpelier Way
- 8533 Montpelier Way
- 8549 Montpelier Way
- 8525 Montpelier Way
- 5581 Mapleton Way
- 8557 Montpelier Way
- 5600 Mapleton Way
- 8566 Montpelier Way
Your Personal Tour Guide
Ask me questions while you tour the home.