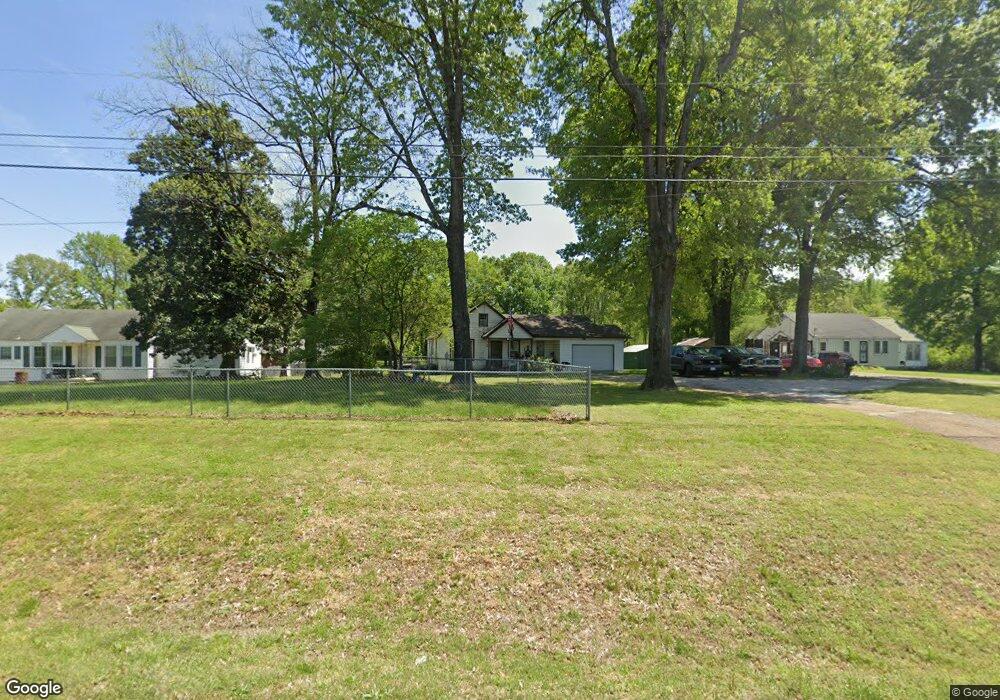
5664 Us Highway 51 N Memphis, TN 38127
Estimated Value: $95,349 - $119,000
2
Beds
1
Bath
1,008
Sq Ft
$105/Sq Ft
Est. Value
About This Home
This home is located at 5664 Us Highway 51 N, Memphis, TN 38127 and is currently estimated at $105,587, approximately $104 per square foot. 5664 Us Highway 51 N is a home located in Shelby County with nearby schools including Lucy Elementary School, Woodstock Middle School, and Bolton High School.
Ownership History
Date
Name
Owned For
Owner Type
Purchase Details
Closed on
May 21, 2009
Sold by
Harrison Carolyn Kathryn and Henderson Larry D
Bought by
Haulum Paul and Gray Violet
Current Estimated Value
Home Financials for this Owner
Home Financials are based on the most recent Mortgage that was taken out on this home.
Original Mortgage
$40,000
Interest Rate
8%
Mortgage Type
Seller Take Back
Purchase Details
Closed on
May 11, 2009
Sold by
Henderson William H
Bought by
Harrison Carolyn Kathryn and Henderson Larry D
Home Financials for this Owner
Home Financials are based on the most recent Mortgage that was taken out on this home.
Original Mortgage
$40,000
Interest Rate
8%
Mortgage Type
Seller Take Back
Purchase Details
Closed on
Oct 14, 2008
Sold by
Cartwright Christine
Bought by
Harrison Carolyn Kathryn and Henderson Larry D
Purchase Details
Closed on
Apr 2, 2001
Sold by
Henderson Chester M and Henderson Jewel K
Bought by
Harrison Carolyn Kathryn and Warrington Jessie Ruth
Create a Home Valuation Report for This Property
The Home Valuation Report is an in-depth analysis detailing your home's value as well as a comparison with similar homes in the area
Home Values in the Area
Average Home Value in this Area
Purchase History
| Date | Buyer | Sale Price | Title Company |
|---|---|---|---|
| Haulum Paul | $60,000 | Security Title Company Inc | |
| Harrison Carolyn Kathryn | -- | None Available | |
| Harrison Carolyn Kathryn | $5,000 | None Available | |
| Harrison Carolyn Kathryn | -- | -- |
Source: Public Records
Mortgage History
| Date | Status | Borrower | Loan Amount |
|---|---|---|---|
| Closed | Haulum Paul | $40,000 |
Source: Public Records
Tax History Compared to Growth
Tax History
| Year | Tax Paid | Tax Assessment Tax Assessment Total Assessment is a certain percentage of the fair market value that is determined by local assessors to be the total taxable value of land and additions on the property. | Land | Improvement |
|---|---|---|---|---|
| 2025 | $645 | $26,400 | $3,725 | $22,675 |
| 2024 | $645 | $19,025 | $3,225 | $15,800 |
| 2023 | $645 | $19,025 | $3,225 | $15,800 |
| 2022 | $645 | $19,025 | $3,225 | $15,800 |
| 2021 | $656 | $19,025 | $3,225 | $15,800 |
| 2020 | $546 | $13,475 | $3,225 | $10,250 |
| 2019 | $546 | $13,475 | $3,225 | $10,250 |
| 2018 | $546 | $13,475 | $3,225 | $10,250 |
| 2017 | $554 | $13,475 | $3,225 | $10,250 |
| 2016 | $535 | $12,250 | $0 | $0 |
| 2014 | $535 | $12,250 | $0 | $0 |
Source: Public Records
Map
Nearby Homes
- 5907 Old Millington Rd
- 2714 Moonview Rd
- 6234 Woodstock Cuba Rd
- 4623 Sunnybrook St
- 4589 Range Line Rd
- 4579 Range Line Rd
- 2620 Maverick Ave
- 2548 Sunny Hill Dr
- 6639 Old Millington Rd
- 4537 Suncrest Dr
- 4532 Sunny View Dr
- 4530 Beacon Hill Dr
- 4518 Suncrest Dr
- 4522 Sunny View Dr
- 4520 Beacon Hill Dr
- 4511 Beacon Hill Dr
- 4511 Range Line Rd
- 4514 Suncrest Dr
- 4502 Beacon Hill Cove
- 2441 Haisch Rd
- 5668 Us Highway 51 N
- 5652 Us Highway 51 N
- 5652 Us 51 Hwy
- 5696 Us Highway 51 N
- 5651 Us Highway 51 N
- 5611 Old Millington Rd
- 5734 U S 51
- 5754 Us Highway 51 N
- 5570 U S 51
- 5525 Old Millington Rd
- 5770 Us 51 Hwy N
- 5599 Old Millington Rd
- 5782 U S 51
- 5547 Old Millington Rd
- 5559 Old Millington Rd
- 5756 Rust Rd
- 2762 Rust Ave
- 5716 Rust Rd
- 5684 Rust Rd
- 2710 Rust Ave