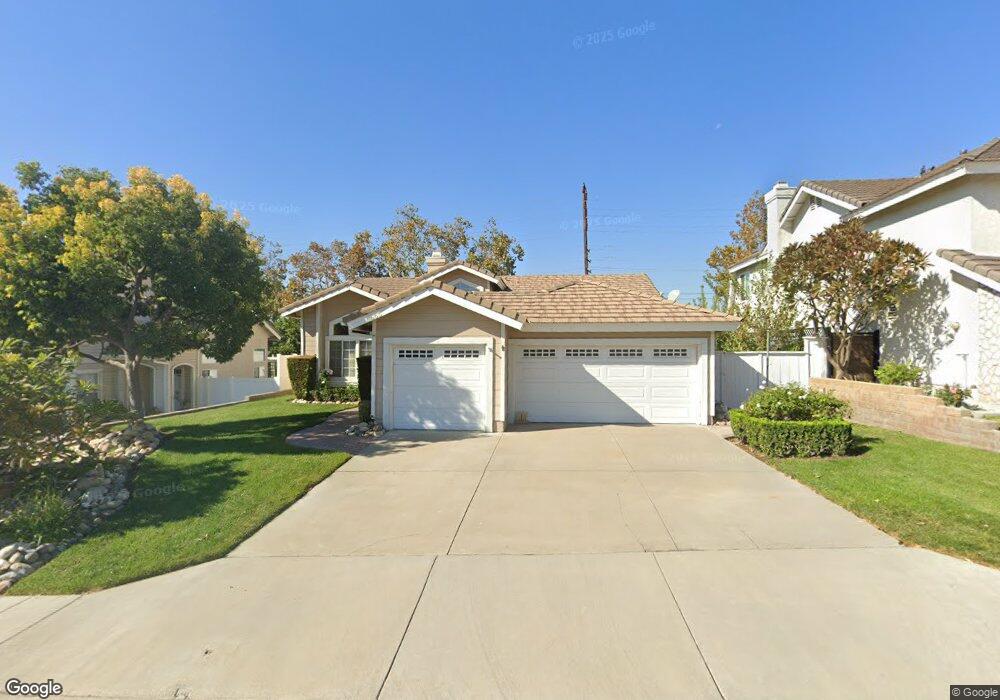
5665 Scotch Pine Ridge Yorba Linda, CA 92886
Estimated Value: $1,177,432 - $1,397,000
3
Beds
2
Baths
1,779
Sq Ft
$715/Sq Ft
Est. Value
About This Home
This home is located at 5665 Scotch Pine Ridge, Yorba Linda, CA 92886 and is currently estimated at $1,271,608, approximately $714 per square foot. 5665 Scotch Pine Ridge is a home located in Orange County with nearby schools including Van Buren Elementary School, Kraemer Middle School, and Valencia High School.
Ownership History
Date
Name
Owned For
Owner Type
Purchase Details
Closed on
Aug 12, 2022
Sold by
Scott Cardwell Ii Charles and Mae Donna
Bought by
Charles S Cardwell Ii And Donna M Cardwell Fa
Current Estimated Value
Purchase Details
Closed on
Nov 25, 1997
Sold by
Kent Howard and Kent Christine
Bought by
Cardwell Ii Charles Scott and Cardwell Donna Mae
Home Financials for this Owner
Home Financials are based on the most recent Mortgage that was taken out on this home.
Original Mortgage
$100,000
Interest Rate
7.16%
Purchase Details
Closed on
Jun 30, 1995
Sold by
Christopherson Donald K and Christopherson Joanne
Bought by
Real Estate Collateral Management Co
Create a Home Valuation Report for This Property
The Home Valuation Report is an in-depth analysis detailing your home's value as well as a comparison with similar homes in the area
Home Values in the Area
Average Home Value in this Area
Purchase History
| Date | Buyer | Sale Price | Title Company |
|---|---|---|---|
| Charles S Cardwell Ii And Donna M Cardwell Fa | -- | None Listed On Document | |
| Cardwell Ii Charles Scott | $237,000 | Landwood Title Company | |
| Real Estate Collateral Management Co | $264,005 | Benefit Land Title Co |
Source: Public Records
Mortgage History
| Date | Status | Borrower | Loan Amount |
|---|---|---|---|
| Previous Owner | Cardwell Ii Charles Scott | $100,000 |
Source: Public Records
Tax History Compared to Growth
Tax History
| Year | Tax Paid | Tax Assessment Tax Assessment Total Assessment is a certain percentage of the fair market value that is determined by local assessors to be the total taxable value of land and additions on the property. | Land | Improvement |
|---|---|---|---|---|
| 2025 | $4,494 | $378,421 | $172,094 | $206,327 |
| 2024 | $4,494 | $371,001 | $168,719 | $202,282 |
| 2023 | $4,405 | $363,727 | $165,411 | $198,316 |
| 2022 | $4,349 | $356,596 | $162,168 | $194,428 |
| 2021 | $4,267 | $349,604 | $158,988 | $190,616 |
| 2020 | $4,156 | $346,020 | $157,358 | $188,662 |
| 2019 | $4,019 | $339,236 | $154,273 | $184,963 |
| 2018 | $3,967 | $332,585 | $151,248 | $181,337 |
| 2017 | $3,902 | $326,064 | $148,282 | $177,782 |
| 2016 | $3,824 | $319,671 | $145,374 | $174,297 |
| 2015 | $3,776 | $314,870 | $143,191 | $171,679 |
| 2014 | $3,665 | $308,703 | $140,386 | $168,317 |
Source: Public Records
Map
Nearby Homes
- 1524 Larsen Ln
- 1527 Evans Ln
- 1561 Ismail Place
- 17225 Orange Blossom Ln
- 1507 E Spruce St Unit A
- 5661 Casa Loma Ave
- 582 Mcfadden St
- 361 S Van Buren St Unit B
- Elina Plan at Vista Rose
- Lyda Plan at Vista Rose
- Prairie Plan at Vista Rose
- Gallica Plan at Vista Rose
- 708 Mcfadden St
- 714 Olivier Dr
- 718 Olivier Dr
- 726 Olivier Dr
- 732 Olivier Dr
- 17842 Caballo Dr
- 653 Patten Ave
- 707 Olivier Dr
- 5655 Scotch Pine Ridge
- 5675 Scotch Pine Ridge
- 5645 Scotch Pine Ridge
- 5685 Scotch Pine Ridge
- 17335 Golden Maple Ln
- 514 Gerhold Ln
- 520 Gerhold Ln
- 5635 Scotch Pine Ridge
- 5695 Scotch Pine Ridge
- 508 Gerhold Ln
- 5680 Scotch Pine Ridge
- 526 Gerhold Ln
- 17345 Golden Maple Ln
- 17330 Majestic Cypress Way
- 5690 Scotch Pine Ridge
- 532 Gerhold Ln
- 5705 Scotch Pine Ridge
- 17340 Majestic Cypress Way
- 17355 Golden Maple Ln
- 5700 Scotch Pine Ridge