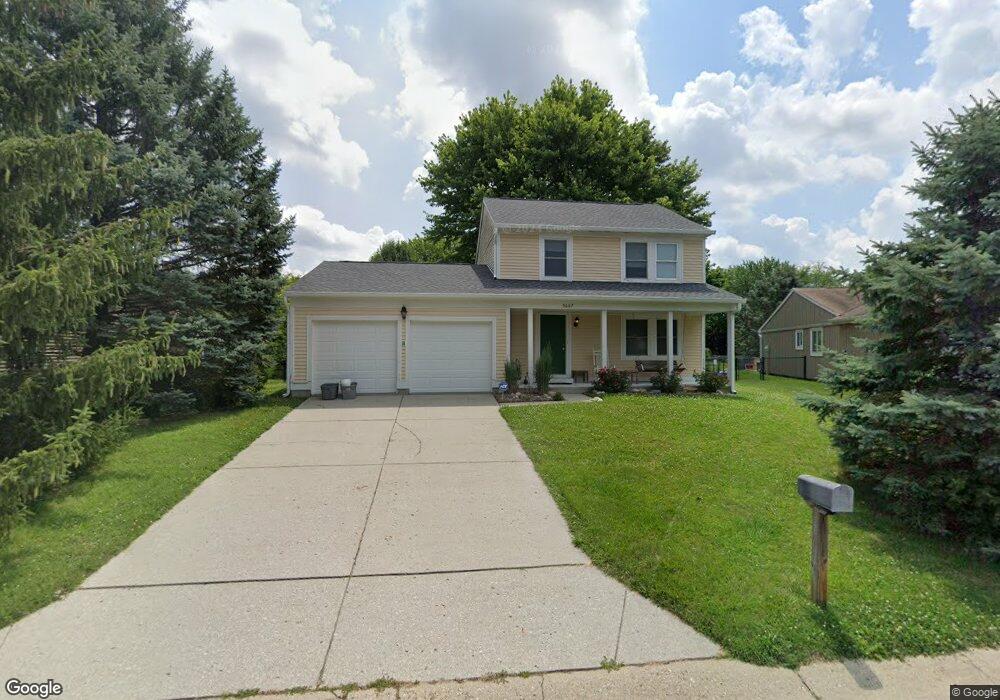
5667 Colonist Cir Indianapolis, IN 46254
Snacks/Guion Creek NeighborhoodEstimated Value: $226,000 - $253,250
3
Beds
2
Baths
2,016
Sq Ft
$119/Sq Ft
Est. Value
About This Home
This home is located at 5667 Colonist Cir, Indianapolis, IN 46254 and is currently estimated at $239,313, approximately $118 per square foot. 5667 Colonist Cir is a home located in Marion County with nearby schools including Pike High School and Indiana Math & Science Academy West.
Ownership History
Date
Name
Owned For
Owner Type
Purchase Details
Closed on
Nov 8, 2011
Sold by
2H Investments Llc
Bought by
Herring Scott
Current Estimated Value
Home Financials for this Owner
Home Financials are based on the most recent Mortgage that was taken out on this home.
Original Mortgage
$90,642
Outstanding Balance
$61,809
Interest Rate
4.02%
Mortgage Type
FHA
Estimated Equity
$177,504
Purchase Details
Closed on
Dec 20, 2010
Sold by
Bollier Gerald
Bought by
2H Investments Llc
Home Financials for this Owner
Home Financials are based on the most recent Mortgage that was taken out on this home.
Original Mortgage
$74,069
Interest Rate
4.44%
Mortgage Type
Unknown
Purchase Details
Closed on
Sep 1, 2010
Sold by
Forum Credit Union
Bought by
Bollier Family Trust
Purchase Details
Closed on
Jun 9, 2010
Sold by
Sites Charles R and Pate Sites Lela J
Bought by
Forum Credit Union and Fimi Inc
Create a Home Valuation Report for This Property
The Home Valuation Report is an in-depth analysis detailing your home's value as well as a comparison with similar homes in the area
Home Values in the Area
Average Home Value in this Area
Purchase History
| Date | Buyer | Sale Price | Title Company |
|---|---|---|---|
| Herring Scott | -- | Chicago Title Company Llc | |
| 2H Investments Llc | -- | Integrity Title Services | |
| Bollier Family Trust | -- | American Integrity Title Inc | |
| Forum Credit Union | $67,500 | None Available |
Source: Public Records
Mortgage History
| Date | Status | Borrower | Loan Amount |
|---|---|---|---|
| Open | Herring Scott | $90,642 | |
| Previous Owner | 2H Investments Llc | $74,069 |
Source: Public Records
Tax History Compared to Growth
Tax History
| Year | Tax Paid | Tax Assessment Tax Assessment Total Assessment is a certain percentage of the fair market value that is determined by local assessors to be the total taxable value of land and additions on the property. | Land | Improvement |
|---|---|---|---|---|
| 2024 | $1,622 | $195,000 | $26,500 | $168,500 |
| 2023 | $1,622 | $160,200 | $26,500 | $133,700 |
| 2022 | $1,628 | $160,200 | $26,500 | $133,700 |
| 2021 | $1,510 | $142,600 | $17,200 | $125,400 |
| 2020 | $1,543 | $146,100 | $17,200 | $128,900 |
| 2019 | $1,490 | $140,900 | $17,200 | $123,700 |
| 2018 | $1,366 | $128,700 | $17,200 | $111,500 |
| 2017 | $1,195 | $118,300 | $17,200 | $101,100 |
| 2016 | $1,080 | $111,200 | $17,200 | $94,000 |
| 2014 | $927 | $106,200 | $17,200 | $89,000 |
| 2013 | $753 | $101,100 | $17,200 | $83,900 |
Source: Public Records
Map
Nearby Homes
- 5684 Colonist Cir
- 5704 Mccloud Ct S
- 5765 Liberty Creek Dr E
- 5851 Brobeck Ln
- 5928 Racine Ln
- 5859 Beaufort Ln
- 6009 Biron Way
- 6047 W 56th St
- 5961 Terrytown Pkwy
- 5956 Staffordshire Cir
- 5167 Pin Oak Dr
- 6006 Buell Ln
- 5163 Climbing Rose Place
- 6107 Patoka Lake Dr
- 6041 Buell Ln
- 4955 Peony Place
- 4946 Amaryllis Ct
- 6069 Buell Ln
- 5451 Bay Harbor Dr
- 5938 Tybalt Ln
- 5671 Colonist Cir
- 5663 Colonist Cir
- 5684 Patriot Way
- 5690 Patriot Way
- 5659 Colonist Cir
- 5675 Colonist Cir
- 5666 Colonist Cir
- 5672 Colonist Cir
- 5683 Patriot Way
- 5678 Patriot Way
- 5655 Colonist Cir
- 5603 Liberty Creek Pkwy
- 5603 Liberty Creek Dr W
- 5678 Colonist Cir
- 5679 Colonist Cir
- 5605 Liberty Creek Dr W
- 5610 Liberty Creek Pkwy
- 5651 Colonist Cir
- 5677 Patriot Way
- 5604 Liberty Creek Dr E