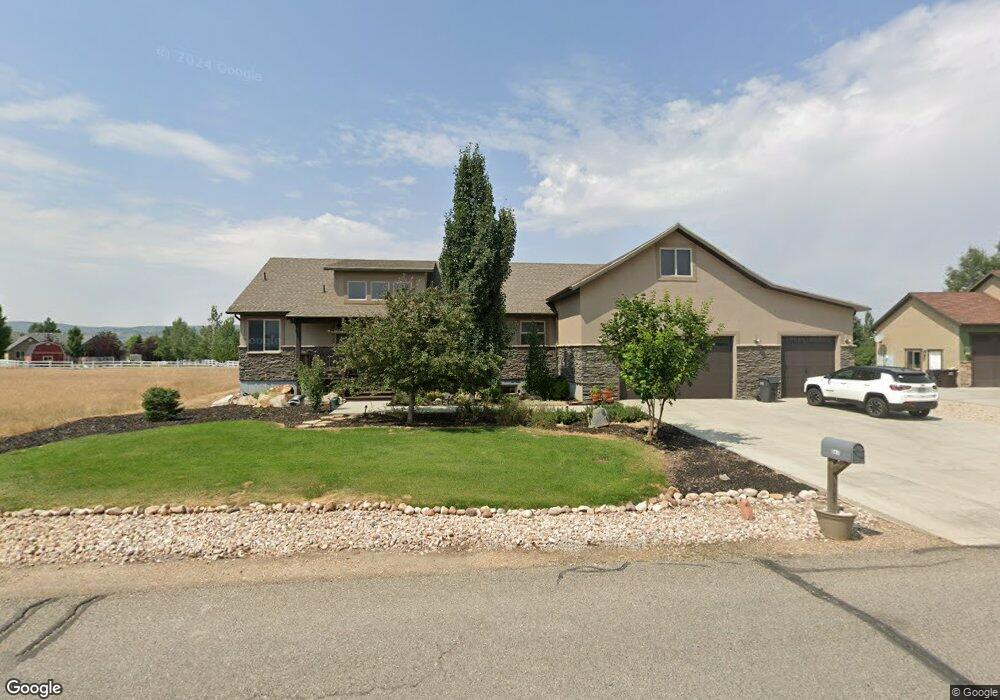
567 Aspen Rd Kamas, UT 84036
Kamas Valley NeighborhoodEstimated Value: $1,353,000 - $1,665,000
3
Beds
3
Baths
5,020
Sq Ft
$299/Sq Ft
Est. Value
About This Home
This home is located at 567 Aspen Rd, Kamas, UT 84036 and is currently estimated at $1,499,570, approximately $298 per square foot. 567 Aspen Rd is a home located in Summit County with nearby schools including South Summit Elementary School and South Summit High School.
Ownership History
Date
Name
Owned For
Owner Type
Purchase Details
Closed on
Jul 20, 2018
Sold by
Rude Lara Perirce and Rude Peter S
Bought by
Rude Lara P and Rude Peter S
Current Estimated Value
Home Financials for this Owner
Home Financials are based on the most recent Mortgage that was taken out on this home.
Original Mortgage
$375,000
Outstanding Balance
$325,712
Interest Rate
4.6%
Mortgage Type
New Conventional
Estimated Equity
$1,173,858
Purchase Details
Closed on
Oct 8, 2007
Sold by
Rude Perter S and Rude Lara Peirce
Bought by
Rude Lara Peirce and Rude Peter S
Home Financials for this Owner
Home Financials are based on the most recent Mortgage that was taken out on this home.
Original Mortgage
$417,000
Interest Rate
6.46%
Mortgage Type
Construction
Purchase Details
Closed on
Aug 9, 2006
Sold by
Wild Willow Ltd Co
Bought by
Rude Peter S and Rude Lara Peorce
Home Financials for this Owner
Home Financials are based on the most recent Mortgage that was taken out on this home.
Original Mortgage
$144,336
Interest Rate
6.76%
Mortgage Type
Purchase Money Mortgage
Create a Home Valuation Report for This Property
The Home Valuation Report is an in-depth analysis detailing your home's value as well as a comparison with similar homes in the area
Home Values in the Area
Average Home Value in this Area
Purchase History
| Date | Buyer | Sale Price | Title Company |
|---|---|---|---|
| Rude Lara P | -- | Coalition Title Agnecy Inc | |
| Rude Lara Peirce | -- | Founders Title Co | |
| Rude Peter S | -- | None Available |
Source: Public Records
Mortgage History
| Date | Status | Borrower | Loan Amount |
|---|---|---|---|
| Open | Rude Lara P | $375,000 | |
| Closed | Rude Lara Peirce | $417,000 | |
| Previous Owner | Rude Peter S | $144,336 |
Source: Public Records
Tax History Compared to Growth
Tax History
| Year | Tax Paid | Tax Assessment Tax Assessment Total Assessment is a certain percentage of the fair market value that is determined by local assessors to be the total taxable value of land and additions on the property. | Land | Improvement |
|---|---|---|---|---|
| 2024 | $4,414 | $729,464 | $175,450 | $554,014 |
| 2023 | $4,414 | $716,264 | $162,250 | $554,014 |
| 2022 | $4,020 | $575,211 | $132,000 | $443,211 |
| 2021 | $3,592 | $400,914 | $73,700 | $327,214 |
| 2020 | $3,194 | $348,975 | $73,700 | $275,275 |
| 2019 | $3,566 | $348,975 | $73,700 | $275,275 |
| 2018 | $2,896 | $294,531 | $66,000 | $228,531 |
| 2017 | $2,731 | $283,531 | $55,000 | $228,531 |
| 2016 | $2,705 | $264,343 | $46,200 | $218,143 |
| 2015 | $2,550 | $243,567 | $0 | $0 |
| 2013 | $2,513 | $222,792 | $0 | $0 |
Source: Public Records
Map
Nearby Homes
- 566 Wild Willow Dr
- 605 Aspen Rd
- 597 Spruce Way Unit C-1
- 431 Aspen Rd
- 755 Oak Ln
- 1962 Bluff Crest Rd
- 1962 Bluff Crest Rd Unit 4
- 1535 Birch Way
- 818 W Summit Haven Cir
- 823 W Summit Haven Cir
- 862 W Hilltop Ct
- 1373 Sage Way
- 1373 Sage Way Unit 47
- 1986 Wren Woods Way
- 1986 Wren Woods Way Unit 13
- 1333 Sage Way
- 1333 Sage Way Unit 45
- 1987 Wren Woods Way
- 1987 Wren Woods Way Unit 24
- 202 Scenic Heights Rd
- 567 Aspen Rd
- 575 Aspen Rd
- 561 Aspen Rd Unit C6
- 561 Aspen Rd
- 1735 Oak Ln
- 574 Aspen Rd
- 574 Aspen Rd Unit C-24
- 1705 Oak Ln
- 1755 Oak Ln
- 1 Woodland View Dr Unit 832
- 557 Aspen Rd
- 581 Aspen Rd
- 560 Aspen Rd
- 1695 Oak Ln
- 583 Wild Willow Dr
- 583 Wild Willow Dr Unit B2
- 551 Aspen Rd Unit C8
- 551 Aspen Rd
- 1795 Oak Ln
- 605 Wild Willow Dr