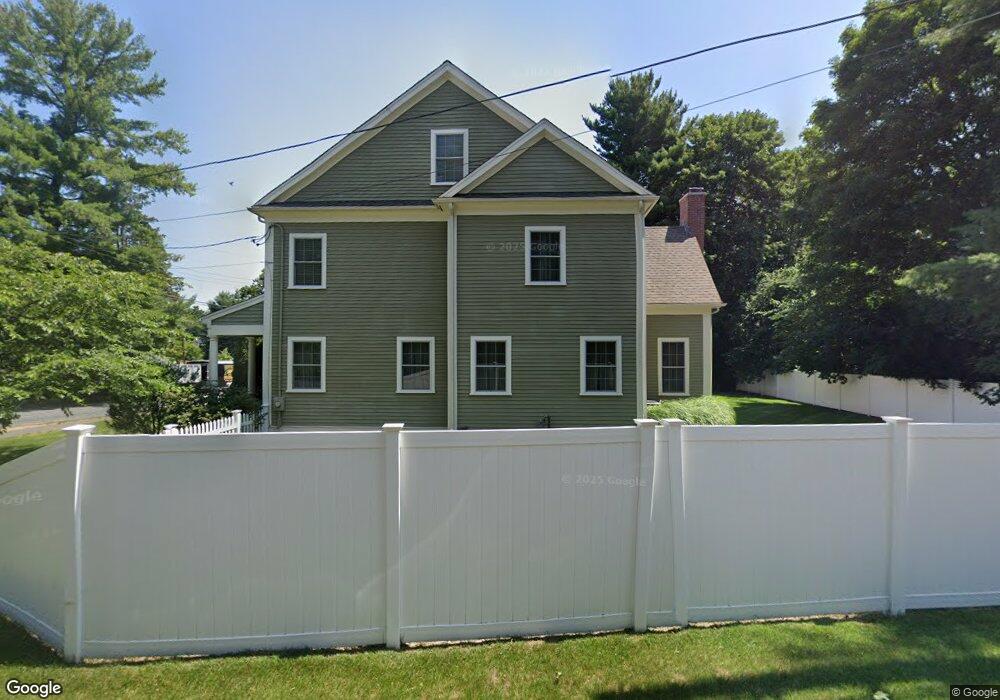
567 High Rock St Needham, MA 02492
Estimated Value: $2,494,000 - $2,741,000
4
Beds
5
Baths
1,993
Sq Ft
$1,314/Sq Ft
Est. Value
About This Home
This home is located at 567 High Rock St, Needham, MA 02492 and is currently estimated at $2,617,828, approximately $1,313 per square foot. 567 High Rock St is a home located in Norfolk County with nearby schools including Newman Elementary School, High Rock Middle School, and Pollard Middle School.
Ownership History
Date
Name
Owned For
Owner Type
Purchase Details
Closed on
Sep 20, 2013
Sold by
Jendav Llc
Bought by
Reid Matthew S and Reid Yanina S
Current Estimated Value
Home Financials for this Owner
Home Financials are based on the most recent Mortgage that was taken out on this home.
Original Mortgage
$750,000
Outstanding Balance
$560,117
Interest Rate
4.42%
Mortgage Type
Purchase Money Mortgage
Estimated Equity
$2,057,711
Purchase Details
Closed on
Feb 1, 2013
Sold by
Rogers & Co Inc
Bought by
Jendav Llc
Home Financials for this Owner
Home Financials are based on the most recent Mortgage that was taken out on this home.
Original Mortgage
$1,024,000
Interest Rate
3.41%
Mortgage Type
Purchase Money Mortgage
Purchase Details
Closed on
Sep 6, 2012
Sold by
Sawyer Mary J
Bought by
Rogers & Co Inc
Home Financials for this Owner
Home Financials are based on the most recent Mortgage that was taken out on this home.
Original Mortgage
$296,738
Interest Rate
3.52%
Mortgage Type
New Conventional
Create a Home Valuation Report for This Property
The Home Valuation Report is an in-depth analysis detailing your home's value as well as a comparison with similar homes in the area
Home Values in the Area
Average Home Value in this Area
Purchase History
| Date | Buyer | Sale Price | Title Company |
|---|---|---|---|
| Reid Matthew S | $1,370,000 | -- | |
| Jendav Llc | $530,000 | -- | |
| Rogers & Co Inc | $520,000 | -- |
Source: Public Records
Mortgage History
| Date | Status | Borrower | Loan Amount |
|---|---|---|---|
| Open | Reid Matthew S | $750,000 | |
| Closed | Reid Matthew S | $50,000 | |
| Previous Owner | Jendav Llc | $1,024,000 | |
| Previous Owner | Rogers & Co Inc | $296,738 |
Source: Public Records
Tax History Compared to Growth
Tax History
| Year | Tax Paid | Tax Assessment Tax Assessment Total Assessment is a certain percentage of the fair market value that is determined by local assessors to be the total taxable value of land and additions on the property. | Land | Improvement |
|---|---|---|---|---|
| 2025 | $23,029 | $2,172,500 | $803,200 | $1,369,300 |
| 2024 | $23,144 | $1,848,600 | $508,800 | $1,339,800 |
| 2023 | $20,990 | $1,609,700 | $508,800 | $1,100,900 |
| 2022 | $20,165 | $1,508,200 | $467,200 | $1,041,000 |
| 2021 | $19,652 | $1,508,200 | $467,200 | $1,041,000 |
| 2020 | $18,315 | $1,466,400 | $467,200 | $999,200 |
| 2019 | $17,469 | $1,409,900 | $425,100 | $984,800 |
| 2018 | $16,750 | $1,409,900 | $425,100 | $984,800 |
| 2017 | $15,203 | $1,278,600 | $425,100 | $853,500 |
| 2016 | $14,854 | $1,287,200 | $425,100 | $862,100 |
| 2015 | $14,532 | $1,287,200 | $425,100 | $862,100 |
| 2014 | $10,147 | $871,700 | $370,200 | $501,500 |
Source: Public Records
Map
Nearby Homes