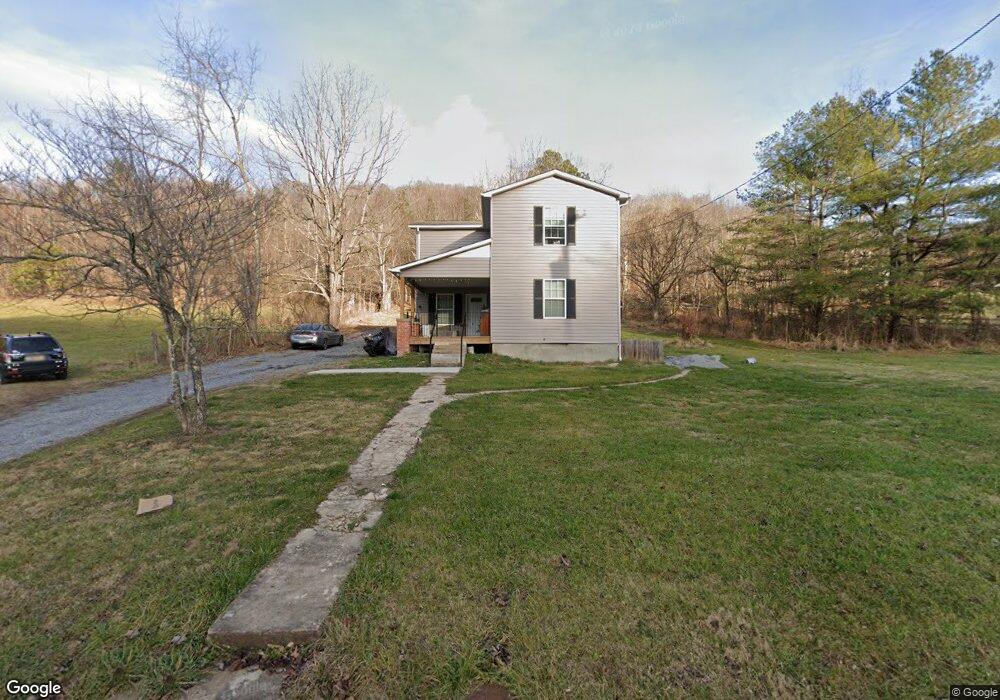
567 Laurels Rd Johnson City, TN 37601
Estimated Value: $171,000 - $280,000
--
Bed
--
Bath
2,117
Sq Ft
$113/Sq Ft
Est. Value
About This Home
This home is located at 567 Laurels Rd, Johnson City, TN 37601 and is currently estimated at $239,444, approximately $113 per square foot. 567 Laurels Rd is a home.
Ownership History
Date
Name
Owned For
Owner Type
Purchase Details
Closed on
Oct 26, 2022
Sold by
Milner Frederick Charles and Milner Melissa C
Bought by
Milner Crystal Nicole
Current Estimated Value
Home Financials for this Owner
Home Financials are based on the most recent Mortgage that was taken out on this home.
Original Mortgage
$156,000
Outstanding Balance
$150,280
Interest Rate
6.02%
Mortgage Type
New Conventional
Estimated Equity
$89,164
Purchase Details
Closed on
Nov 22, 2021
Sold by
Maughon Terry and Maughon Karen
Bought by
Milner Frederick Charles and Milner Melissa C
Purchase Details
Closed on
Mar 9, 2017
Sold by
Es Markland Steven Russell
Bought by
Maughon Terry and Maughon Karen
Purchase Details
Closed on
Apr 15, 1999
Sold by
Markland Steven Russell
Bought by
Southerland Neil
Purchase Details
Closed on
Jun 8, 1990
Bought by
Markland Steven Russell
Purchase Details
Closed on
Feb 3, 1948
Bought by
Sullivan Millard and Sullivan Nellie
Create a Home Valuation Report for This Property
The Home Valuation Report is an in-depth analysis detailing your home's value as well as a comparison with similar homes in the area
Home Values in the Area
Average Home Value in this Area
Purchase History
| Date | Buyer | Sale Price | Title Company |
|---|---|---|---|
| Milner Crystal Nicole | $195,000 | -- | |
| Milner Frederick Charles | $40,000 | None Available | |
| Maughon Terry | $25,000 | -- | |
| Southerland Neil | $6,900 | -- | |
| Markland Steven Russell | $32,800 | -- | |
| Sullivan Millard | -- | -- |
Source: Public Records
Mortgage History
| Date | Status | Borrower | Loan Amount |
|---|---|---|---|
| Open | Milner Crystal Nicole | $156,000 |
Source: Public Records
Tax History Compared to Growth
Tax History
| Year | Tax Paid | Tax Assessment Tax Assessment Total Assessment is a certain percentage of the fair market value that is determined by local assessors to be the total taxable value of land and additions on the property. | Land | Improvement |
|---|---|---|---|---|
| 2024 | $600 | $27,500 | $6,025 | $21,475 |
| 2023 | $600 | $27,500 | $0 | $0 |
| 2022 | $356 | $17,550 | $6,025 | $11,525 |
| 2021 | $356 | $17,550 | $6,025 | $11,525 |
| 2020 | $346 | $17,550 | $6,025 | $11,525 |
| 2019 | $346 | $14,025 | $4,825 | $9,200 |
| 2018 | $346 | $14,025 | $4,825 | $9,200 |
| 2017 | $346 | $14,025 | $4,825 | $9,200 |
| 2016 | $345 | $14,075 | $4,875 | $9,200 |
| 2015 | $345 | $14,075 | $4,875 | $9,200 |
| 2014 | $302 | $12,325 | $4,150 | $8,175 |
Source: Public Records
Map
Nearby Homes
- 665 Laurels Rd
- 114 Treadway Ln
- Tbd Fire Station Rd
- 167 Sheets Hollow Rd
- 1523 Whispering Pines Rd
- 366 Toll Branch Rd
- 225 Sheets Hollow Rd
- 144 Blue Bird Dr
- 236 Rock House Rd
- 1883 Powder Branch Rd
- Tr 15 Pine Forest Ln
- Tr 15.01 Pine Forest Ln
- Tr 14 Pine Forest Ln
- 114 Whisperwood Ln
- Tbd Whispering Pines Rd
- Tr 15 Mountain Laurel Ct
- Tr 13 Mountain Laurel Ct
- Tr 11 Mountain Laurel Ct
- Tr 9 Mountain Laurel Ct
- Tr 7 Mountain Laurel Ct
- 566 Laurels Rd
- 553 Laurels Rd
- 589 Laurels Rd
- 590 Laurels Rd
- 546 Laurels Rd
- 596 Laurels Rd
- 601 Laurels Rd
- 584 Laurels Rd
- 602 Laurels Rd
- Tract 1 Laurels Rd
- Tract 2 Laurels Rd
- 423 Laurels Rd
- 655 Laurels Rd
- 00 Laurels Rd
- 670 Laurels Rd
- 676 Laurels Rd
- 0 Laurels Rd
- 690 Laurels Rd
- 694 Laurels Rd
- 535 Laurels Rd