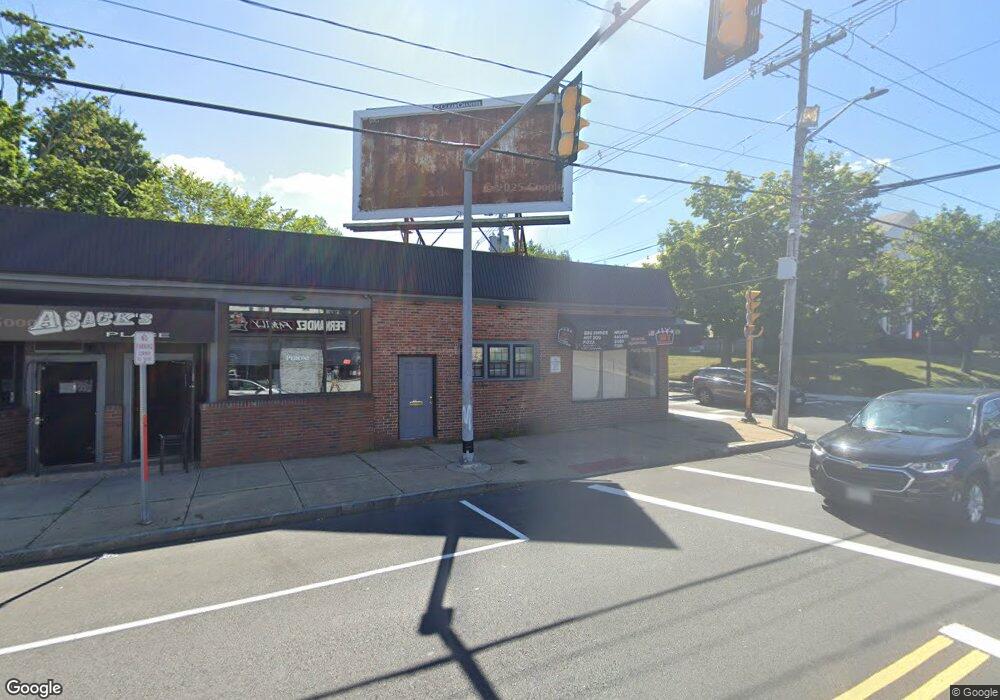
567 N Main St Brockton, MA 02301
Montello NeighborhoodEstimated Value: $1,077,617
8
Beds
4
Baths
3,348
Sq Ft
$322/Sq Ft
Est. Value
About This Home
This home is located at 567 N Main St, Brockton, MA 02301 and is currently estimated at $1,077,617, approximately $321 per square foot. 567 N Main St is a home located in Plymouth County with nearby schools including Louis F Angelo Elementary School, Raymond K-8 Elementary School, and Manthala George Jr. School.
Ownership History
Date
Name
Owned For
Owner Type
Purchase Details
Closed on
Nov 1, 1990
Sold by
Sergi Richard J
Bought by
Asack Peter L
Current Estimated Value
Home Financials for this Owner
Home Financials are based on the most recent Mortgage that was taken out on this home.
Original Mortgage
$223,250
Interest Rate
10.07%
Mortgage Type
Commercial
Create a Home Valuation Report for This Property
The Home Valuation Report is an in-depth analysis detailing your home's value as well as a comparison with similar homes in the area
Home Values in the Area
Average Home Value in this Area
Purchase History
| Date | Buyer | Sale Price | Title Company |
|---|---|---|---|
| Asack Peter L | $253,250 | -- |
Source: Public Records
Mortgage History
| Date | Status | Borrower | Loan Amount |
|---|---|---|---|
| Closed | Asack Peter L | $223,250 |
Source: Public Records
Tax History Compared to Growth
Tax History
| Year | Tax Paid | Tax Assessment Tax Assessment Total Assessment is a certain percentage of the fair market value that is determined by local assessors to be the total taxable value of land and additions on the property. | Land | Improvement |
|---|---|---|---|---|
| 2025 | $9,460 | $390,900 | $152,700 | $238,200 |
| 2024 | $8,771 | $364,700 | $138,800 | $225,900 |
| 2023 | $8,623 | $331,400 | $108,600 | $222,800 |
| 2022 | $8,460 | $300,200 | $108,600 | $191,600 |
| 2021 | $8,492 | $286,500 | $103,400 | $183,100 |
| 2020 | $8,712 | $286,500 | $98,500 | $188,000 |
| 2019 | $8,674 | $273,900 | $98,500 | $175,400 |
| 2018 | $8,906 | $268,000 | $98,500 | $169,500 |
| 2017 | $8,643 | $262,400 | $98,500 | $163,900 |
| 2016 | $8,194 | $255,900 | $98,500 | $157,400 |
| 2015 | $8,670 | $255,900 | $98,500 | $157,400 |
| 2014 | $8,690 | $255,900 | $98,500 | $157,400 |
Source: Public Records
Map
Nearby Homes
- 560 N Montello St
- 39 Upland Rd
- 24 E Ashland St
- 95 Battles St
- 0 Vine St
- 35 Huntington St
- 39 Huntington St
- 115 Ames St
- 77 Porter St
- 112 Ames St
- 731 N Montello St Unit 6
- 737 N Montello St
- 90 Cherry St
- 144 Ames St
- 30 Intervale St
- 20 Johnson Ct
- 0 Prospect St
- 69 Beacon Park
- 29 Saint Casimir Ave
- 10 Fitzpatrick Ave
- 34 E Main St Unit 2 South
- 34 E Main St Unit 2 North
- 34 E Main St
- 568 Main St
- 566 N Main St
- 574 N Main St
- 574 N Main St Unit 1
- 44 E Main St
- 578 N Main St
- 582 N Main St
- 587 N Main St
- 35 E Main St
- 50 E Main St
- 9 Battles St
- 11 Battles St
- 554 N Main St
- 554 N Main St Unit 3
- 41 E Main St
- 29 E Main St
- 45 E Main St