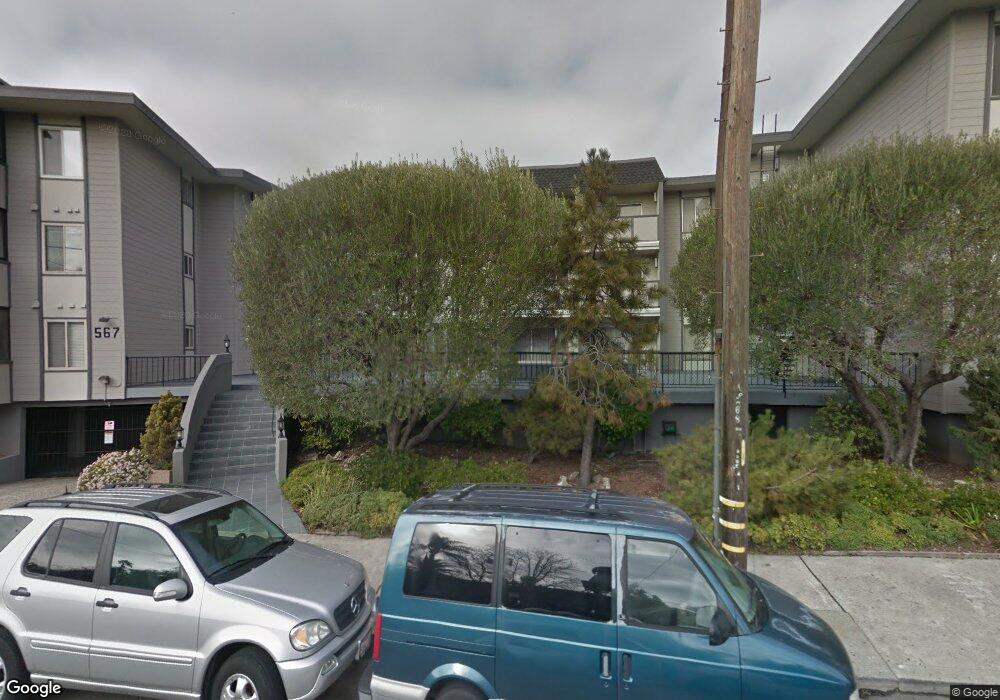
567 Oakland Ave Unit 302 Oakland, CA 94611
Grand Lake NeighborhoodEstimated Value: $292,000 - $469,000
1
Bed
1
Bath
626
Sq Ft
$571/Sq Ft
Est. Value
About This Home
This home is located at 567 Oakland Ave Unit 302, Oakland, CA 94611 and is currently estimated at $357,233, approximately $570 per square foot. 567 Oakland Ave Unit 302 is a home located in Alameda County with nearby schools including Piedmont Avenue Elementary School, Westlake Middle School, and Oakland Technical High School.
Ownership History
Date
Name
Owned For
Owner Type
Purchase Details
Closed on
Aug 23, 2016
Sold by
Crosslin Lora C
Bought by
Crosslin Lora C
Current Estimated Value
Home Financials for this Owner
Home Financials are based on the most recent Mortgage that was taken out on this home.
Original Mortgage
$208,000
Outstanding Balance
$165,638
Interest Rate
3.42%
Mortgage Type
New Conventional
Estimated Equity
$191,595
Purchase Details
Closed on
Apr 13, 2015
Sold by
Crosslin Lora
Bought by
Crosslin Lora C
Purchase Details
Closed on
Aug 9, 2005
Sold by
Mcdonald Tamara R
Bought by
Crosslin Lora
Home Financials for this Owner
Home Financials are based on the most recent Mortgage that was taken out on this home.
Original Mortgage
$244,000
Interest Rate
5.12%
Mortgage Type
Purchase Money Mortgage
Purchase Details
Closed on
Jul 5, 2001
Sold by
Sirknockum Archero and Sirknockum Sydney M
Bought by
Mcdonald Tamara R
Home Financials for this Owner
Home Financials are based on the most recent Mortgage that was taken out on this home.
Original Mortgage
$177,025
Interest Rate
7.24%
Mortgage Type
FHA
Purchase Details
Closed on
Apr 12, 2001
Sold by
Sirknockum Archero and Sirknockum Sydney
Bought by
Sirknockum Archero and Sirknockum Sydney
Home Financials for this Owner
Home Financials are based on the most recent Mortgage that was taken out on this home.
Original Mortgage
$100,000
Interest Rate
6.98%
Mortgage Type
Purchase Money Mortgage
Purchase Details
Closed on
Jul 31, 2000
Sold by
Sirknockum Archero
Bought by
Sirknockum Sydney
Purchase Details
Closed on
Jun 22, 2000
Sold by
Sirknockum Sydney
Bought by
Sirknockum Archero and Sirknockum Sydney M
Purchase Details
Closed on
Jun 3, 1998
Sold by
Sau Craig Cecilia Yee
Bought by
Sirknockum Sydney
Home Financials for this Owner
Home Financials are based on the most recent Mortgage that was taken out on this home.
Original Mortgage
$70,350
Interest Rate
7.1%
Mortgage Type
Purchase Money Mortgage
Purchase Details
Closed on
Mar 29, 1996
Sold by
Craig Cecilia Yee Sau
Bought by
Craig Cecilila Yee Sau
Home Financials for this Owner
Home Financials are based on the most recent Mortgage that was taken out on this home.
Original Mortgage
$48,000
Interest Rate
7.34%
Mortgage Type
Purchase Money Mortgage
Purchase Details
Closed on
May 13, 1994
Sold by
Craig Donald F
Bought by
Craig Cecilia Yee Sau
Create a Home Valuation Report for This Property
The Home Valuation Report is an in-depth analysis detailing your home's value as well as a comparison with similar homes in the area
Home Values in the Area
Average Home Value in this Area
Purchase History
| Date | Buyer | Sale Price | Title Company |
|---|---|---|---|
| Crosslin Lora C | -- | Placer Title Company | |
| Crosslin Lora C | -- | Placer Title Company | |
| Crosslin Lora C | -- | None Available | |
| Crosslin Lora | $305,000 | First American Title Co | |
| Mcdonald Tamara R | $186,500 | Placer Title Company | |
| Sirknockum Archero | -- | Financial Title Company | |
| Sirknockum Sydney | -- | -- | |
| Sirknockum Archero | -- | -- | |
| Sirknockum Sydney | $71,500 | Old Republic Title Company | |
| Craig Cecilila Yee Sau | -- | -- | |
| Craig Cecilia Yee Sau | -- | -- |
Source: Public Records
Mortgage History
| Date | Status | Borrower | Loan Amount |
|---|---|---|---|
| Open | Crosslin Lora C | $208,000 | |
| Closed | Crosslin Lora | $244,000 | |
| Previous Owner | Mcdonald Tamara R | $177,025 | |
| Previous Owner | Sirknockum Archero | $100,000 | |
| Previous Owner | Sirknockum Sydney | $70,350 | |
| Previous Owner | Craig Cecilila Yee Sau | $48,000 | |
| Closed | Mcdonald Tamara R | $9,125 |
Source: Public Records
Tax History Compared to Growth
Tax History
| Year | Tax Paid | Tax Assessment Tax Assessment Total Assessment is a certain percentage of the fair market value that is determined by local assessors to be the total taxable value of land and additions on the property. | Land | Improvement |
|---|---|---|---|---|
| 2025 | $6,866 | $409,770 | $125,031 | $291,739 |
| 2024 | $6,866 | $401,598 | $122,579 | $286,019 |
| 2023 | $7,155 | $400,590 | $120,177 | $280,413 |
| 2022 | $6,936 | $385,735 | $117,820 | $274,915 |
| 2021 | $6,567 | $378,037 | $115,511 | $269,526 |
| 2020 | $6,493 | $381,090 | $114,327 | $266,763 |
| 2019 | $6,208 | $373,621 | $112,086 | $261,535 |
| 2018 | $6,079 | $366,298 | $109,889 | $256,409 |
| 2017 | $5,830 | $359,118 | $107,735 | $251,383 |
| 2016 | $5,598 | $352,078 | $105,623 | $246,455 |
| 2015 | $4,341 | $257,000 | $77,100 | $179,900 |
| 2014 | $3,721 | $210,000 | $63,000 | $147,000 |
Source: Public Records
Map
Nearby Homes
- 567 Oakland Ave Unit 305
- 567 Oakland Ave Unit 104
- 567 Oakland Ave Unit 101
- 3750 Harrison St Unit 302
- 127 Bayo Vista Ave Unit 108
- 590 El Dorado Ave Unit 208
- 22 Moss Ave Unit 107
- 695 Mariposa Ave Unit 204
- 94 Bayo Vista Ave Unit 304
- 323 Monte Vista Ave Unit 103
- 323 Monte Vista Ave Unit 107
- 401 Monte Vista Ave Unit U103
- 671 Vernon St
- 500 Vernon St Unit 110
- 500 Vernon St Unit 305
- 758 Kingston Ave Unit 25
- 655 Chetwood St Unit 402
- 3537 Kempton Way
- 425 Orange St Unit 112
- 567 Oakland Ave Unit 303
- 567 Oakland Ave Unit condo for rent in a
- 567 Oakland Ave Unit Great condo for rent
- 567 Oakland Ave Unit 304
- 567 Oakland Ave Unit 113
- 567 Oakland Ave Unit 308
- 567 Oakland Ave Unit 310
- 567 Oakland Ave Unit 106
- 567 Oakland Ave Unit 209
- 567 Oakland Ave Unit 201
- 567 Oakland Ave Unit 205
- 567 Oakland Ave Unit 204
- 567 Oakland Ave Unit 112
- 567 Oakland Ave Unit 307
- 567 Oakland Ave Unit 313
- 567 Oakland Ave Unit 309
- 567 Oakland Ave Unit 307
- 567 Oakland Ave Unit 109
- 567 Oakland Ave Unit 203
- 567 Oakland Ave Unit 301