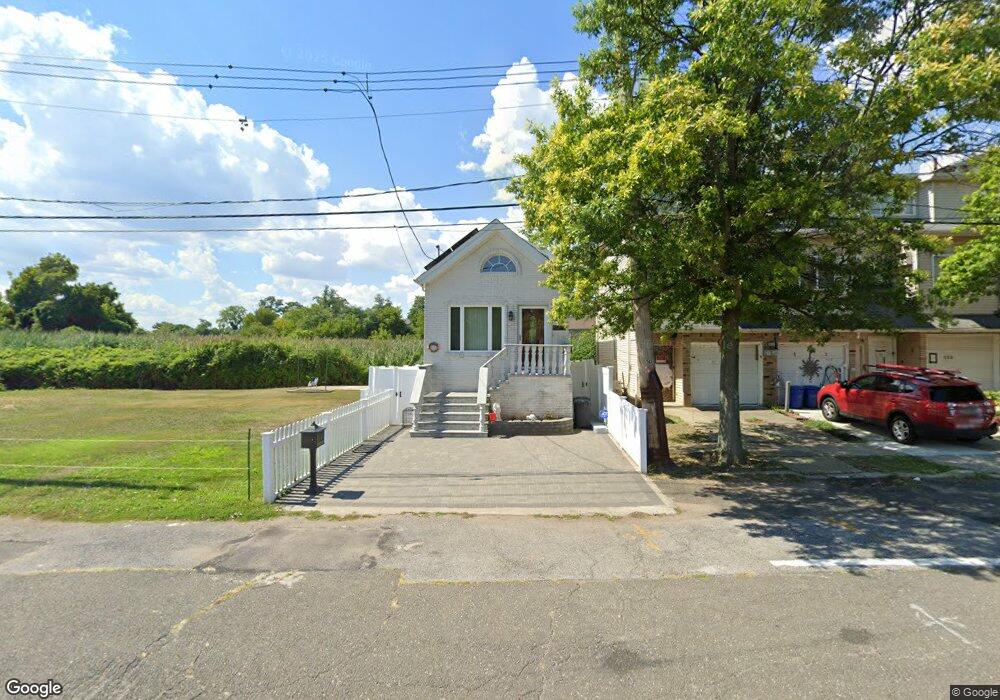
567 Quincy Ave Staten Island, NY 10305
Ocean Breeze NeighborhoodEstimated Value: $465,773 - $576,000
3
Beds
1
Bath
672
Sq Ft
$773/Sq Ft
Est. Value
About This Home
This home is located at 567 Quincy Ave, Staten Island, NY 10305 and is currently estimated at $519,693, approximately $773 per square foot. 567 Quincy Ave is a home located in Richmond County with nearby schools including P.S. 052 John C. Thompson, Is 2 George L Egbert, and New Dorp High School.
Ownership History
Date
Name
Owned For
Owner Type
Purchase Details
Closed on
Nov 9, 2001
Sold by
Odonnell Anthony
Bought by
Mckeon Catherine Scarciofolo
Current Estimated Value
Home Financials for this Owner
Home Financials are based on the most recent Mortgage that was taken out on this home.
Original Mortgage
$126,350
Interest Rate
6.61%
Purchase Details
Closed on
Apr 30, 1996
Sold by
Riccio Marta
Bought by
Odonnell Anthony
Home Financials for this Owner
Home Financials are based on the most recent Mortgage that was taken out on this home.
Original Mortgage
$118,750
Interest Rate
7.67%
Mortgage Type
Balloon
Purchase Details
Closed on
Nov 10, 1995
Sold by
Datello Carrie Lynn
Bought by
Riccio Martha
Purchase Details
Closed on
May 16, 1995
Sold by
Desposito Joseph and Desposito Michael
Bought by
Datello Carrie Lynn
Create a Home Valuation Report for This Property
The Home Valuation Report is an in-depth analysis detailing your home's value as well as a comparison with similar homes in the area
Home Values in the Area
Average Home Value in this Area
Purchase History
| Date | Buyer | Sale Price | Title Company |
|---|---|---|---|
| Mckeon Catherine Scarciofolo | $133,000 | -- | |
| Odonnell Anthony | $125,000 | -- | |
| Riccio Martha | $31,000 | -- | |
| Datello Carrie Lynn | $56,000 | -- |
Source: Public Records
Mortgage History
| Date | Status | Borrower | Loan Amount |
|---|---|---|---|
| Previous Owner | Mckeon Catherine Scarciofolo | $126,350 | |
| Previous Owner | Odonnell Anthony | $118,750 |
Source: Public Records
Tax History Compared to Growth
Tax History
| Year | Tax Paid | Tax Assessment Tax Assessment Total Assessment is a certain percentage of the fair market value that is determined by local assessors to be the total taxable value of land and additions on the property. | Land | Improvement |
|---|---|---|---|---|
| 2025 | $1,661 | $19,740 | $3,910 | $15,830 |
| 2024 | $1,673 | $18,420 | $4,190 | $14,230 |
| 2023 | $1,664 | $9,593 | $4,154 | $5,439 |
| 2022 | $1,520 | $15,660 | $8,340 | $7,320 |
| 2021 | $1,495 | $14,460 | $8,340 | $6,120 |
| 2020 | $231 | $14,280 | $8,340 | $5,940 |
| 2019 | $215 | $13,800 | $8,340 | $5,460 |
| 2018 | $1,332 | $7,994 | $5,144 | $2,850 |
| 2017 | $1,238 | $7,543 | $5,190 | $2,353 |
| 2016 | $1,113 | $7,118 | $3,689 | $3,429 |
| 2015 | $984 | $6,717 | $3,481 | $3,236 |
| 2014 | $984 | $6,717 | $3,481 | $3,236 |
Source: Public Records
Map
Nearby Homes
- 762 Seaview Ave
- 0 Quincy Ave
- 000 Quincy Ave
- 431 Patterson Ave
- 602 Seaview Ave
- 795 Father Capodanno Blvd
- 797 Father Capodanno Blvd
- 799 Father Capodanno Blvd
- 498 Dongan Hills Ave
- 521 Buel Ave
- 517 Buel Ave
- 473 Dongan Hills Ave
- 467 Dongan Hills Ave
- 9 Iroquois St
- 197 Slater Blvd
- 929 Father Capodanno Blvd
- 00 Baden Place
- 0 Baden Place Unit 2503276
- 188 Graham Blvd Unit B
- 428 Cromwell Ave
- 569 Quincy Ave
- 563 Quincy Ave
- 575 Quincy Ave
- 696 Seaview Ave
- 694 Seaview Ave
- 123 Quincy Ave
- 576 Quincy Ave
- 730-732 Seaview Ave
- 730 Seaview Ave Unit 732
- 622 Quincy Ave
- 622 Quincy Ave
- 568 Quincy Ave
- 572 Quincy Ave
- 736 Seaview Ave
- 11 Quincy Ave
- 0001 Quincy Ave
- 005 Quincy Ave
- 003 Quincy Ave
- 0000 Quincy Ave
- 4444 Quincy Ave