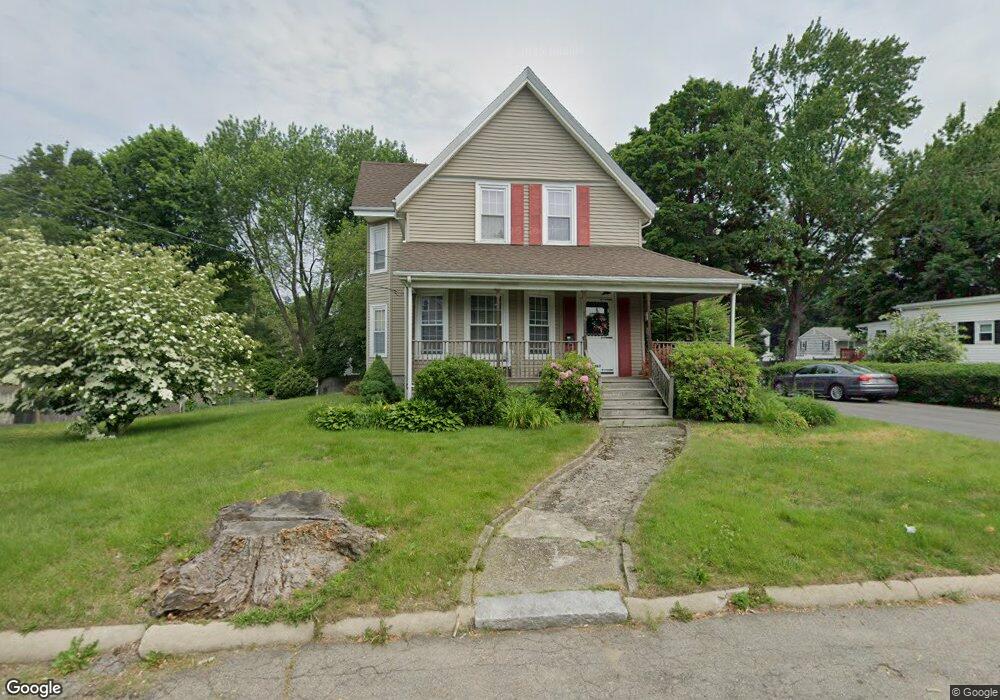
567 Summer St Brockton, MA 02302
Campello NeighborhoodEstimated Value: $470,000 - $607,000
3
Beds
2
Baths
1,558
Sq Ft
$348/Sq Ft
Est. Value
About This Home
This home is located at 567 Summer St, Brockton, MA 02302 and is currently estimated at $541,479, approximately $347 per square foot. 567 Summer St is a home located in Plymouth County with nearby schools including Gilmore Elementary School, Davis K-8 School, and John F. Kennedy Elementary School.
Ownership History
Date
Name
Owned For
Owner Type
Purchase Details
Closed on
Aug 1, 1994
Sold by
Crehan William P and Crehan Ann F
Bought by
Analoro Denise F
Current Estimated Value
Home Financials for this Owner
Home Financials are based on the most recent Mortgage that was taken out on this home.
Original Mortgage
$80,275
Interest Rate
8.25%
Mortgage Type
Purchase Money Mortgage
Create a Home Valuation Report for This Property
The Home Valuation Report is an in-depth analysis detailing your home's value as well as a comparison with similar homes in the area
Home Values in the Area
Average Home Value in this Area
Purchase History
| Date | Buyer | Sale Price | Title Company |
|---|---|---|---|
| Analoro Denise F | $84,500 | -- |
Source: Public Records
Mortgage History
| Date | Status | Borrower | Loan Amount |
|---|---|---|---|
| Open | Analoro Denise F | $15,000 | |
| Open | Analoro Denise F | $104,000 | |
| Closed | Analoro Denise F | $80,275 | |
| Previous Owner | Analoro Denise F | $15,000 |
Source: Public Records
Tax History
| Year | Tax Paid | Tax Assessment Tax Assessment Total Assessment is a certain percentage of the fair market value that is determined by local assessors to be the total taxable value of land and additions on the property. | Land | Improvement |
|---|---|---|---|---|
| 2025 | $5,760 | $475,600 | $164,100 | $311,500 |
| 2024 | $5,610 | $466,700 | $164,100 | $302,600 |
| 2023 | $5,688 | $438,200 | $114,600 | $323,600 |
| 2022 | $5,281 | $378,000 | $104,200 | $273,800 |
| 2021 | $5,140 | $354,500 | $98,000 | $256,500 |
| 2020 | $4,593 | $303,200 | $85,400 | $217,800 |
| 2019 | $4,430 | $285,100 | $82,100 | $203,000 |
| 2018 | $4,219 | $262,700 | $82,100 | $180,600 |
| 2017 | $3,903 | $242,400 | $82,100 | $160,300 |
| 2016 | $3,467 | $199,700 | $78,200 | $121,500 |
| 2015 | $3,327 | $183,300 | $78,200 | $105,100 |
| 2014 | $3,325 | $183,400 | $78,200 | $105,200 |
Source: Public Records
Map
Nearby Homes
Your Personal Tour Guide
Ask me questions while you tour the home.