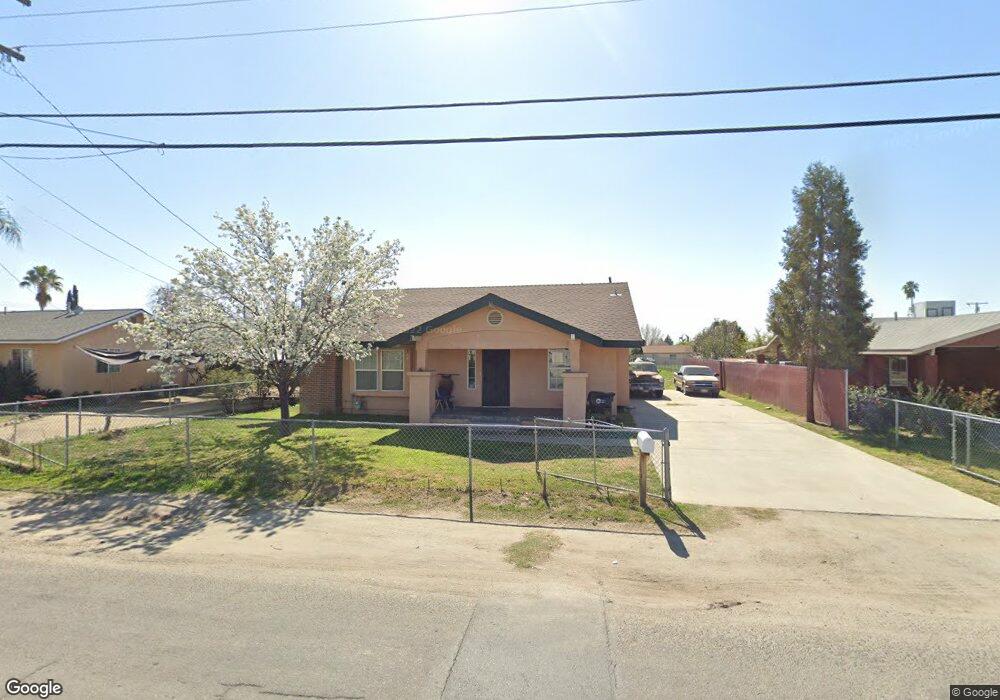
567 Union Ave Porterville, CA 93257
Southwest Porterville NeighborhoodEstimated Value: $264,000 - $307,000
2
Beds
1
Bath
1,145
Sq Ft
$248/Sq Ft
Est. Value
About This Home
This home is located at 567 Union Ave, Porterville, CA 93257 and is currently estimated at $284,328, approximately $248 per square foot. 567 Union Ave is a home located in Tulare County with nearby schools including Olive Street Elementary School, Bartlett Middle School, and Porterville High School.
Ownership History
Date
Name
Owned For
Owner Type
Purchase Details
Closed on
Feb 6, 2020
Sold by
Bermudez Rolando Lupe
Bought by
Bermudez Maria Salud
Current Estimated Value
Home Financials for this Owner
Home Financials are based on the most recent Mortgage that was taken out on this home.
Original Mortgage
$119,000
Outstanding Balance
$81,989
Interest Rate
3.6%
Mortgage Type
New Conventional
Estimated Equity
$202,339
Purchase Details
Closed on
Jun 23, 1997
Sold by
Lowery Robert N
Bought by
Bermudez Rolando Lupe and Bermudez Maria Salud
Purchase Details
Closed on
Jul 28, 1994
Sold by
Lowery Robert N
Bought by
Bermudez Rolando Lupe and Bermudez Maria Salud
Home Financials for this Owner
Home Financials are based on the most recent Mortgage that was taken out on this home.
Original Mortgage
$63,000
Interest Rate
8.65%
Create a Home Valuation Report for This Property
The Home Valuation Report is an in-depth analysis detailing your home's value as well as a comparison with similar homes in the area
Home Values in the Area
Average Home Value in this Area
Purchase History
| Date | Buyer | Sale Price | Title Company |
|---|---|---|---|
| Bermudez Maria Salud | -- | Stewart Title Of Ca Inc | |
| Bermudez Rolando Lupe | -- | Chicago Title Co | |
| Bermudez Rolando Lupe | $70,000 | First American Title Ins Co |
Source: Public Records
Mortgage History
| Date | Status | Borrower | Loan Amount |
|---|---|---|---|
| Open | Bermudez Maria Salud | $119,000 | |
| Previous Owner | Bermudez Rolando Lupe | $63,000 |
Source: Public Records
Tax History Compared to Growth
Tax History
| Year | Tax Paid | Tax Assessment Tax Assessment Total Assessment is a certain percentage of the fair market value that is determined by local assessors to be the total taxable value of land and additions on the property. | Land | Improvement |
|---|---|---|---|---|
| 2025 | $1,750 | $128,730 | $33,596 | $95,134 |
| 2024 | $1,750 | $126,207 | $32,938 | $93,269 |
| 2023 | $1,748 | $123,734 | $32,293 | $91,441 |
| 2022 | $1,706 | $121,309 | $31,660 | $89,649 |
| 2021 | $1,691 | $118,930 | $31,039 | $87,891 |
| 2020 | $1,677 | $117,711 | $30,721 | $86,990 |
| 2019 | $1,271 | $115,403 | $30,119 | $85,284 |
| 2018 | $1,248 | $113,140 | $29,528 | $83,612 |
| 2017 | $1,218 | $110,922 | $28,949 | $81,973 |
| 2016 | $1,169 | $108,747 | $28,381 | $80,366 |
| 2015 | $1,124 | $107,114 | $27,955 | $79,159 |
| 2014 | $1,124 | $105,015 | $27,407 | $77,608 |
Source: Public Records
Map
Nearby Homes
- 579 S Villa St
- 1183 S Creekside St
- 1152 S Creekside St
- 1132 S Creekside St
- 249 W Orange Ave
- 0 SE Indianna & Springville Dr Unit 221030
- 61 N Sinarle Place
- 553 S Cloverleaf St
- 0 W Vandalia Ave Unit 237772
- 643 S Cloverleaf St
- 1066 W Forest Ave
- 63 N Wisconsin St
- 1127 W Orange Ave
- 293 N Villa St
- 292 N Villa St
- 450 W Joan Ave
- 658 W Willow Oak Ave
- 347 Ohio Cir
- 1121 S Cottage St
- 1151 S Cottage St