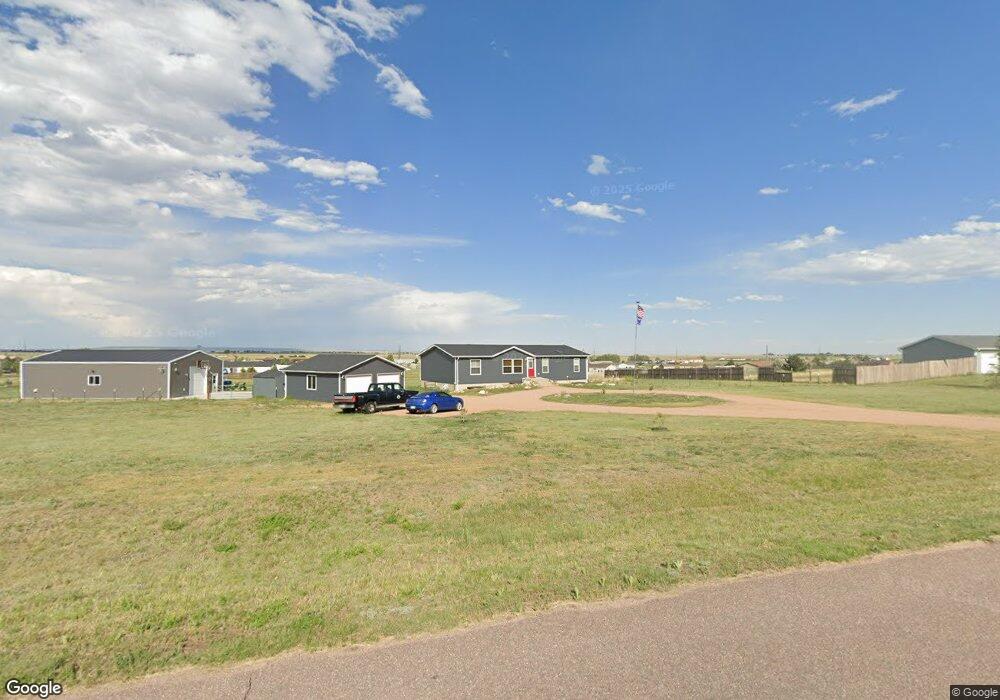
5671 Jocque Ct Peyton, CO 80831
Falcon NeighborhoodEstimated Value: $479,236 - $498,000
6
Beds
3
Baths
3,220
Sq Ft
$152/Sq Ft
Est. Value
About This Home
This home is located at 5671 Jocque Ct, Peyton, CO 80831 and is currently estimated at $489,559, approximately $152 per square foot. 5671 Jocque Ct is a home located in El Paso County with nearby schools including Falcon Elementary School Of Technology, Falcon Middle School, and Falcon High School.
Ownership History
Date
Name
Owned For
Owner Type
Purchase Details
Closed on
Apr 22, 2021
Sold by
Walker Nichelle and Walker Mario
Bought by
Kopecky John Michael and Kopecky Monica Christine
Current Estimated Value
Home Financials for this Owner
Home Financials are based on the most recent Mortgage that was taken out on this home.
Original Mortgage
$395,034
Outstanding Balance
$357,237
Interest Rate
3.1%
Mortgage Type
VA
Estimated Equity
$132,322
Purchase Details
Closed on
Jul 11, 2002
Sold by
Seeger Homes Inc
Bought by
Walker Mario and Walker Nichelle L
Home Financials for this Owner
Home Financials are based on the most recent Mortgage that was taken out on this home.
Original Mortgage
$180,172
Interest Rate
6.76%
Mortgage Type
FHA
Purchase Details
Closed on
Apr 10, 2002
Sold by
Southfork Development Ltd
Bought by
Seager Homes Inc
Create a Home Valuation Report for This Property
The Home Valuation Report is an in-depth analysis detailing your home's value as well as a comparison with similar homes in the area
Home Values in the Area
Average Home Value in this Area
Purchase History
| Date | Buyer | Sale Price | Title Company |
|---|---|---|---|
| Kopecky John Michael | $425,000 | First American Title | |
| Walker Mario | $183,000 | Title America | |
| Seager Homes Inc | $45,000 | Title America |
Source: Public Records
Mortgage History
| Date | Status | Borrower | Loan Amount |
|---|---|---|---|
| Open | Kopecky John Michael | $395,034 | |
| Previous Owner | Walker Mario | $180,172 |
Source: Public Records
Tax History
| Year | Tax Paid | Tax Assessment Tax Assessment Total Assessment is a certain percentage of the fair market value that is determined by local assessors to be the total taxable value of land and additions on the property. | Land | Improvement |
|---|---|---|---|---|
| 2025 | $2,682 | $37,360 | -- | -- |
| 2024 | $2,573 | $35,760 | $6,280 | $29,480 |
| 2023 | $2,573 | $35,760 | $6,280 | $29,480 |
| 2022 | $2,387 | $29,060 | $4,780 | $24,280 |
| 2021 | $2,309 | $27,850 | $4,920 | $22,930 |
| 2020 | $1,691 | $20,320 | $3,780 | $16,540 |
| 2019 | $1,678 | $20,320 | $3,780 | $16,540 |
| 2018 | $1,331 | $15,900 | $3,410 | $12,490 |
| 2017 | $1,236 | $15,900 | $3,410 | $12,490 |
| 2016 | $1,124 | $14,520 | $3,580 | $10,940 |
| 2015 | $1,125 | $14,520 | $3,580 | $10,940 |
| 2014 | $1,040 | $13,210 | $3,290 | $9,920 |
Source: Public Records
Map
Nearby Homes
- 5664 Southfork Dr
- 14934 Pamela Way
- 15101 Oscuro Trail
- 14961 Oscuro Trail
- 14891 Oscuro Trail
- 15381 Oscuro Trail
- 4215 Los Ranchitos Dr
- 7464 Truchas Trail
- 16390 Stage Stop Rd
- 15150 Del Cerro Trail
- 6525 Connie Lee Ct
- 6545 Connie Lee Ct
- 7698 Truchas Trail
- 7776 Truchas Trail
- 16575 Cathys Loop
- 5535 Peerless Farms Rd
- 5810 Whipshaw Rd
- 6315 Peerless Farms Rd
- 5510 Whipshaw Rd
- 8071 Estacado Place
- 5653 Jocque Ct
- 5672 Jocque Ct
- 6065 Southfork Dr
- 5984 Southfork Dr
- 6025 Southfork Dr Unit 8404
- 5635 Jocque Ct
- 5654 Jocque Ct
- 15550 Bobby Ct
- 6105 Southfork Dr
- 5636 Jocque Ct
- 5985 Southfork Dr
- 15526 Bobby Ct
- 5944 Southfork Dr
- 6104 Southfork Dr
- 5617 Jocque Ct
- 5945 Southfork Dr
- 5618 Jocque Ct
- 6145 Southfork Dr
- 5904 Southfork Dr
- 14979 Clifford Dr
Your Personal Tour Guide
Ask me questions while you tour the home.