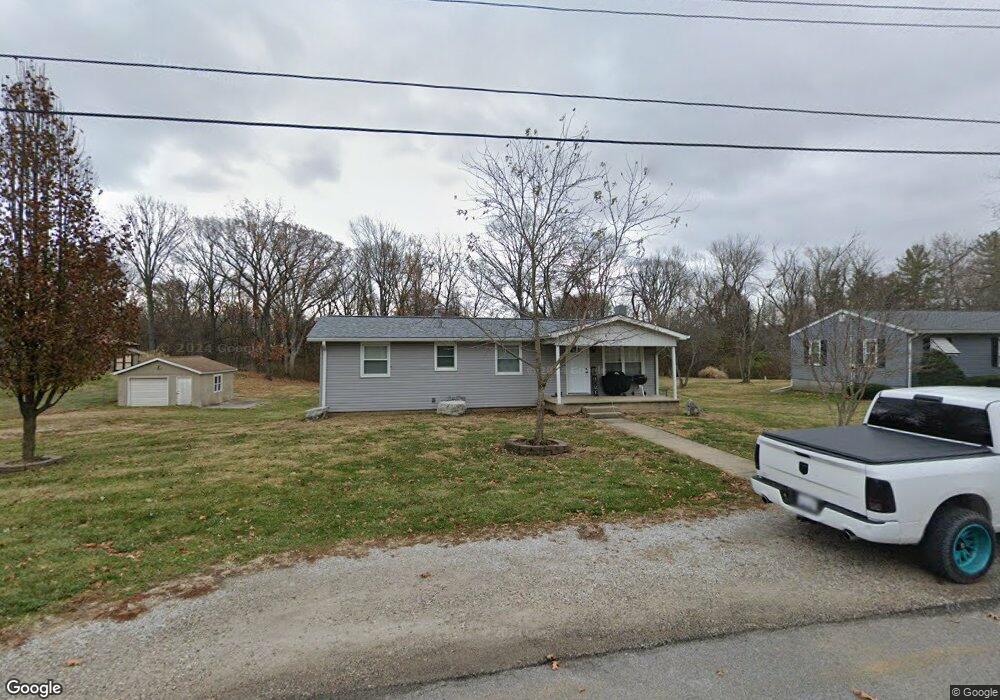
5675 E Milspring Cir Godfrey, IL 62035
Estimated Value: $127,000 - $160,000
4
Beds
1
Bath
1,056
Sq Ft
$139/Sq Ft
Est. Value
About This Home
This home is located at 5675 E Milspring Cir, Godfrey, IL 62035 and is currently estimated at $146,978, approximately $139 per square foot. 5675 E Milspring Cir is a home located in Madison County with nearby schools including Lewis & Clark Elementary School, Alton Middle School, and Alton High School.
Ownership History
Date
Name
Owned For
Owner Type
Purchase Details
Closed on
Jul 23, 2021
Sold by
Mcgee Christopher A
Bought by
Snyders Bryley Lynn Danielle
Current Estimated Value
Home Financials for this Owner
Home Financials are based on the most recent Mortgage that was taken out on this home.
Original Mortgage
$105,730
Outstanding Balance
$97,126
Interest Rate
3.75%
Mortgage Type
New Conventional
Estimated Equity
$49,852
Purchase Details
Closed on
Aug 12, 2010
Sold by
Mcconahey Vanette
Bought by
Mcgee Christopher Allen
Purchase Details
Closed on
Mar 10, 2005
Sold by
Carver Angela M
Bought by
Mcgee Christopher A
Home Financials for this Owner
Home Financials are based on the most recent Mortgage that was taken out on this home.
Original Mortgage
$70,000
Interest Rate
5.7%
Mortgage Type
Purchase Money Mortgage
Create a Home Valuation Report for This Property
The Home Valuation Report is an in-depth analysis detailing your home's value as well as a comparison with similar homes in the area
Purchase History
| Date | Buyer | Sale Price | Title Company |
|---|---|---|---|
| Snyders Bryley Lynn Danielle | $109,000 | Community Title & Escrow | |
| Mcgee Christopher Allen | $500 | None Available | |
| Mcgee Christopher A | $70,000 | Community Title & Escrow Ltd |
Source: Public Records
Mortgage History
| Date | Status | Borrower | Loan Amount |
|---|---|---|---|
| Open | Snyders Bryley Lynn Danielle | $105,730 | |
| Previous Owner | Mcgee Christopher A | $70,000 |
Source: Public Records
Tax History
| Year | Tax Paid | Tax Assessment Tax Assessment Total Assessment is a certain percentage of the fair market value that is determined by local assessors to be the total taxable value of land and additions on the property. | Land | Improvement |
|---|---|---|---|---|
| 2024 | $2,618 | $44,830 | $11,380 | $33,450 |
| 2023 | $2,618 | $41,390 | $10,510 | $30,880 |
| 2022 | $2,469 | $37,850 | $9,610 | $28,240 |
| 2021 | $2,204 | $35,600 | $9,040 | $26,560 |
| 2020 | $2,155 | $34,830 | $8,840 | $25,990 |
| 2019 | $2,195 | $33,920 | $8,610 | $25,310 |
| 2018 | $2,156 | $32,470 | $8,240 | $24,230 |
| 2017 | $2,050 | $32,470 | $8,240 | $24,230 |
| 2016 | $1,991 | $32,470 | $8,240 | $24,230 |
| 2015 | $1,778 | $31,450 | $7,980 | $23,470 |
| 2014 | $1,778 | $31,450 | $7,980 | $23,470 |
| 2013 | $1,778 | $31,450 | $7,980 | $23,470 |
Source: Public Records
Map
Nearby Homes
- 5667 Humbert Rd
- 0 Humbert Rd Unit MIS25052876
- 4821 Wick Mor Dr
- 400 Saint Rose Dr
- 00 Pine Ridge Lot#52 Dr
- 208 Pine Ridge Dr
- 201 Pine Ridge Dr
- 4832 Bambi Dr
- 5205 Wickway Dr
- 406 Celesta St Unit 91
- 4709 Snow White Terrace
- 5214 Willis Ave Unit 201
- 4803 Azalea Place Unit 1
- 801 Stamper Ln
- 4715 Richland Woods Ct
- 4443 Delta Queen Ln
- 0 Deer Run Dr Unit MIS26021751
- Tbd Godfrey Rd
- 369 Hand Dr
- 0 Humbert Rd Unit MIS26022914
- 5671 E Milspring Cir
- 5677 E Milspring Cir
- 5674 E Milspring Cir
- 205 N Milspring Cir
- 5672 E Milspring Cir
- 208 N Milspring Cir
- 5669 E Milspring Cir
- 206 N Milspring Cir
- 5670 E Milspring Cir
- 5667 E Milspring Cir
- 5040 Terry Dr
- 5669 W Milspring Cir
- 5667 W Milspring Cir
- 202 N Milspring Cir
- 5665 W Milspring Cir
- 5050 Terry Dr
- 5662 E Milspring Cir
- 5671 W Milspring Cir
- 200 N Milspring Cir
- 5665 E Milspring Cir
Your Personal Tour Guide
Ask me questions while you tour the home.