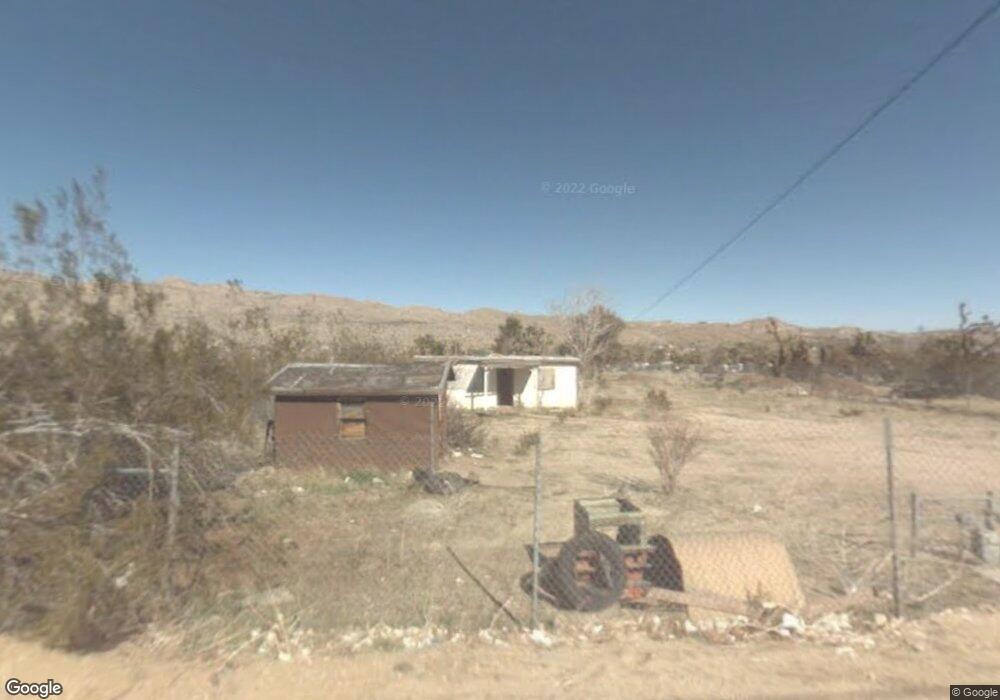
56756 Rabbit Trail Yucca Valley, CA 92284
Estimated Value: $138,947 - $364,000
--
Bed
--
Bath
368
Sq Ft
$683/Sq Ft
Est. Value
About This Home
This home is located at 56756 Rabbit Trail, Yucca Valley, CA 92284 and is currently estimated at $251,474, approximately $683 per square foot. 56756 Rabbit Trail is a home located in San Bernardino County with nearby schools including Yucca Valley Elementary School, La Contenta Middle School, and Yucca Valley High School.
Ownership History
Date
Name
Owned For
Owner Type
Purchase Details
Closed on
Apr 11, 2023
Sold by
Cinar Veerle
Bought by
Ongun Cumhur
Current Estimated Value
Purchase Details
Closed on
Mar 6, 2019
Sold by
Cinar Karazona
Bought by
Cinar Veerle
Home Financials for this Owner
Home Financials are based on the most recent Mortgage that was taken out on this home.
Original Mortgage
$40,000
Interest Rate
4.3%
Mortgage Type
Purchase Money Mortgage
Purchase Details
Closed on
Aug 2, 2016
Sold by
Pritchard Matthew L
Bought by
Summer Thomas and Summer Linda
Purchase Details
Closed on
Nov 9, 2012
Sold by
Robbins Syvia
Bought by
Pritchard Matthew L
Purchase Details
Closed on
Apr 13, 2012
Sold by
Robbins Sylvia
Bought by
Robbins Sylvia and The Sylvia Robbins Trust
Purchase Details
Closed on
Dec 4, 2007
Sold by
Robins Sylvia
Bought by
Robins Sylvia
Create a Home Valuation Report for This Property
The Home Valuation Report is an in-depth analysis detailing your home's value as well as a comparison with similar homes in the area
Home Values in the Area
Average Home Value in this Area
Purchase History
| Date | Buyer | Sale Price | Title Company |
|---|---|---|---|
| Ongun Cumhur | -- | None Listed On Document | |
| Cinar Veerle | -- | First American Title Company | |
| Ongun Cumhur | $80,000 | First American Title Company | |
| Summer Thomas | $87,121 | Accommodation | |
| Pritchard Matthew L | -- | Fidelity National Title | |
| Robbins Sylvia | -- | None Available | |
| Robins Sylvia | -- | None Available |
Source: Public Records
Mortgage History
| Date | Status | Borrower | Loan Amount |
|---|---|---|---|
| Previous Owner | Ongun Cumhur | $40,000 |
Source: Public Records
Tax History Compared to Growth
Tax History
| Year | Tax Paid | Tax Assessment Tax Assessment Total Assessment is a certain percentage of the fair market value that is determined by local assessors to be the total taxable value of land and additions on the property. | Land | Improvement |
|---|---|---|---|---|
| 2025 | $3,557 | $166,868 | $78,969 | $87,899 |
| 2024 | $3,557 | $163,596 | $77,421 | $86,175 |
| 2023 | $2,433 | $85,776 | $26,805 | $58,971 |
| 2022 | $2,337 | $84,094 | $26,279 | $57,815 |
| 2021 | $2,440 | $82,445 | $25,764 | $56,681 |
| 2020 | $2,253 | $81,600 | $25,500 | $56,100 |
| 2019 | $1,135 | $38,495 | $15,606 | $22,889 |
| 2018 | $835 | $37,740 | $15,300 | $22,440 |
| 2017 | $475 | $37,135 | $15,066 | $22,069 |
| 2016 | $467 | $36,407 | $14,771 | $21,636 |
| 2015 | $456 | $35,860 | $14,549 | $21,311 |
| 2014 | $452 | $35,158 | $14,264 | $20,894 |
Source: Public Records
Map
Nearby Homes
- 7199 Grand Ave
- 56646 Antelope Trail
- 54553 29 Palms Hwy
- 55601 29 Palms Hwy
- 56565 Antelope Trail
- 7408 Desert Sky Dr
- 56669 Desert Vista Cir
- 7639 Ventura Ave
- 7420 Desert Sky Dr
- 7432 Desert Sky Dr
- 7444 Desert Sky Dr
- 7395 Sage Ave
- 7419 Sage Ave
- 0 Antelope Trail Unit OC24084101
- 5872821 Yucca Trail
- 56637 Desert Vista Cir
- 57054 Antelope Trail
- 7344 Palm Ave
- 0 Cassia Dr Unit HD24234322
- 0 Yucca Trail Unit JT25230190
- 56767 Antelope Trail
- 56778 Twenty-Nine Palms Hwy
- 56795 Antelope Trail
- 56778 Twentynine Palms Hwy Unit 4
- 56778 29 Palms Hwy
- 56742 Antelope Trail
- 56790 Antelope Trail
- 56768 Antelope Trail
- 7252 Grand Ave
- 7248 Grand Ave
- 56818 Antelope Trail
- 7236 Grand Ave
- 56835 Antelope Trail
- 7226 Grand Ave
- 56869 Antelope Trail
- 56869 Antelope Trail
- 56869 Antelope Trail
- 56869 Antelope Trail
- 56869 Antelope Trail
- 56869 Antelope Trail