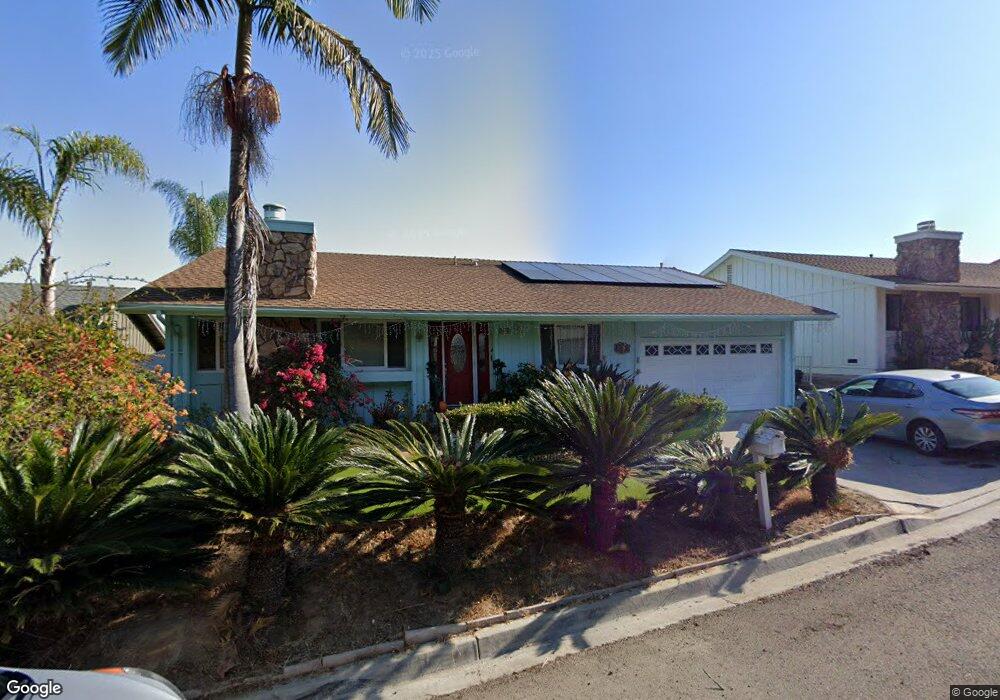
5678 Desert View Dr La Jolla, CA 92037
Soledad South NeighborhoodEstimated Value: $1,646,000 - $2,010,702
3
Beds
2
Baths
1,793
Sq Ft
$1,038/Sq Ft
Est. Value
About This Home
This home is located at 5678 Desert View Dr, La Jolla, CA 92037 and is currently estimated at $1,861,926, approximately $1,038 per square foot. 5678 Desert View Dr is a home located in San Diego County with nearby schools including La Jolla Elementary School, Muirlands Middle School, and La Jolla High School.
Ownership History
Date
Name
Owned For
Owner Type
Purchase Details
Closed on
Dec 11, 2015
Sold by
Azimi Robert B and Azimi Soraya G
Bought by
Azimi Family Trust and Azimi Soraya G
Current Estimated Value
Purchase Details
Closed on
Aug 22, 1995
Sold by
Azimi Robert Behzad and Ghamaty Soraya
Bought by
Azimi Robert Behzad and Azimi Soraya Ghamaty
Home Financials for this Owner
Home Financials are based on the most recent Mortgage that was taken out on this home.
Original Mortgage
$247,000
Interest Rate
7.5%
Purchase Details
Closed on
Feb 6, 1995
Sold by
North Frances D and North James S
Bought by
Azimi Robert Behzad and Ghamaty Soraya
Home Financials for this Owner
Home Financials are based on the most recent Mortgage that was taken out on this home.
Original Mortgage
$247,500
Interest Rate
9.23%
Create a Home Valuation Report for This Property
The Home Valuation Report is an in-depth analysis detailing your home's value as well as a comparison with similar homes in the area
Home Values in the Area
Average Home Value in this Area
Purchase History
| Date | Buyer | Sale Price | Title Company |
|---|---|---|---|
| Azimi Family Trust | -- | None Available | |
| Azimi Robert Behzad | -- | None Available | |
| Azimi Robert Behzad | -- | South Coast Title Company | |
| Azimi Robert Behzad | $275,000 | United Title Company |
Source: Public Records
Mortgage History
| Date | Status | Borrower | Loan Amount |
|---|---|---|---|
| Closed | Azimi Robert Behzad | $247,000 | |
| Closed | Azimi Robert Behzad | $247,500 |
Source: Public Records
Tax History Compared to Growth
Tax History
| Year | Tax Paid | Tax Assessment Tax Assessment Total Assessment is a certain percentage of the fair market value that is determined by local assessors to be the total taxable value of land and additions on the property. | Land | Improvement |
|---|---|---|---|---|
| 2025 | $5,955 | $498,821 | $168,587 | $330,234 |
| 2024 | $5,955 | $489,041 | $165,282 | $323,759 |
| 2023 | $5,822 | $479,453 | $162,042 | $317,411 |
| 2022 | $5,665 | $470,053 | $158,865 | $311,188 |
| 2021 | $5,625 | $460,837 | $155,750 | $305,087 |
| 2020 | $5,556 | $456,112 | $154,153 | $301,959 |
| 2019 | $5,456 | $447,170 | $151,131 | $296,039 |
| 2018 | $5,100 | $438,403 | $148,168 | $290,235 |
| 2017 | $80 | $429,808 | $145,263 | $284,545 |
| 2016 | $4,896 | $421,381 | $142,415 | $278,966 |
| 2015 | $4,822 | $415,052 | $140,276 | $274,776 |
| 2014 | $4,745 | $406,923 | $137,529 | $269,394 |
Source: Public Records
Map
Nearby Homes
- 2173 Caminito San Martin
- 5745 Soledad Mountain Rd
- 2163 Caminito Circulo Norte Unit 126
- 5826 Soledad Mountain Rd
- 2065 Caminito San Nicholas
- 5497 Coral Reef Ave
- 2294 Caminito Preciosa Norte
- 5515 Thunderbird Ln
- 2223 Caminito Preciosa Sur Unit 111
- 6071 Wooddale Row
- 2742 Ariane Dr Unit 153
- 2252 Soledad Rancho Rd
- 5435 Parkview Dr
- 5259 Pacifica Dr
- 5227 Middleton Rd
- 4654 Lisann St
- 1608 Caminito Asterisco
- 1619 Calle de Primra
- 4690 Lisann St
- 5165 Pacifica Dr
- 5688 Desert View Dr
- 5668 Desert View Dr
- 5706 Desert View Dr
- 5658 Desert View Dr
- 5681 Desert View Dr
- 5675 Soledad Mountain Rd
- 5685 Soledad Mountain Rd
- 5663 Desert View Dr Unit 12
- 5691 Desert View Dr
- 5695 Soledad Mountain Rd
- 5648 Desert View Dr
- 5720 Desert View Dr
- 5655 Soledad Mountain Rd
- 5653 Desert View Dr
- 5703 Soledad Mountain Rd
- 5638 Desert View Dr
- 5645 Soledad Mountain Rd
- 5643 Desert View Dr
- 5723 Desert View Dr
- 5715 Soledad Mountain Rd Unit 209