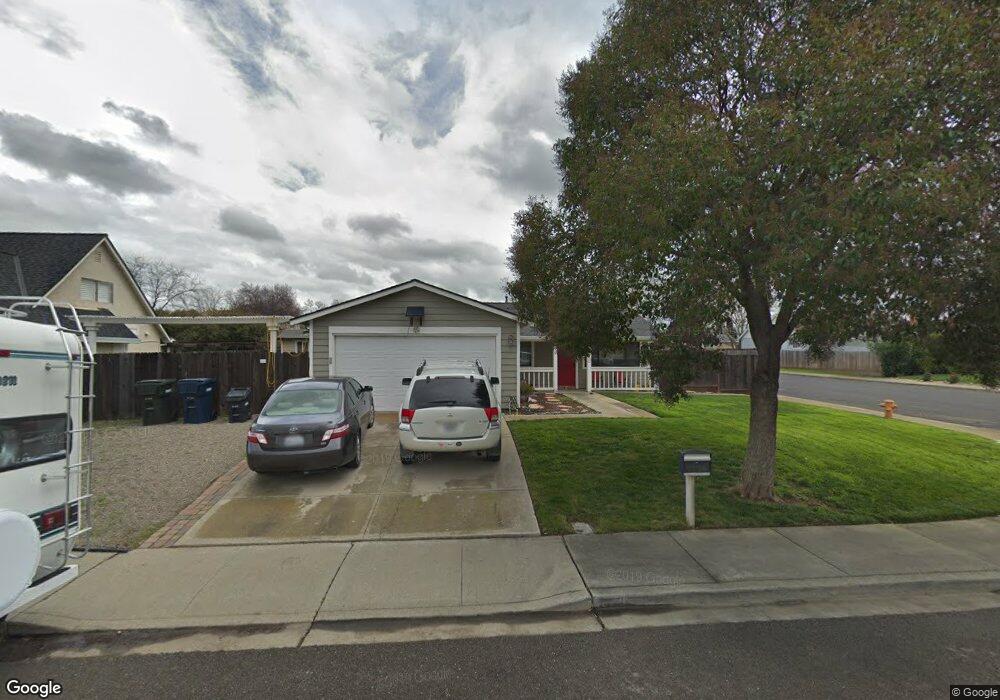
5678 Firestone Rd Livermore, CA 94551
Springtown NeighborhoodEstimated Value: $524,000 - $931,000
3
Beds
2
Baths
1,408
Sq Ft
$566/Sq Ft
Est. Value
About This Home
This home is located at 5678 Firestone Rd, Livermore, CA 94551 and is currently estimated at $796,392, approximately $565 per square foot. 5678 Firestone Rd is a home located in Alameda County with nearby schools including Altamont Creek Elementary School, Andrew N. Christensen Middle School, and Livermore High School.
Ownership History
Date
Name
Owned For
Owner Type
Purchase Details
Closed on
Sep 20, 2024
Sold by
Broset William A
Bought by
Sabyl Myers Revocable Trust and Broset
Current Estimated Value
Purchase Details
Closed on
Jan 4, 2018
Sold by
Broset Sabyl Noel and Myers Sabyl N
Bought by
Broset Sabyl Noel and Sabyl Myers Revocable Trust
Purchase Details
Closed on
Jul 10, 2015
Sold by
Myers Sabyl and The Sabyl Myers Revocable Trus
Bought by
Myers Sabyl N and Broset William A
Home Financials for this Owner
Home Financials are based on the most recent Mortgage that was taken out on this home.
Original Mortgage
$140,000
Interest Rate
3.85%
Mortgage Type
Credit Line Revolving
Purchase Details
Closed on
Sep 17, 2012
Sold by
Myers Sabyl
Bought by
Myers Sabyl and Sabyl Myers Revocable Trust
Home Financials for this Owner
Home Financials are based on the most recent Mortgage that was taken out on this home.
Original Mortgage
$253,000
Interest Rate
3.55%
Mortgage Type
New Conventional
Purchase Details
Closed on
May 24, 2012
Sold by
Myers Sabyl Noel
Bought by
Myers Sabyl and Sabyl Myers Revocable Trust
Purchase Details
Closed on
Sep 15, 2010
Sold by
Kelly Ryan John and Kelly Joanna Kristine
Bought by
Myers Sabyl Noel
Home Financials for this Owner
Home Financials are based on the most recent Mortgage that was taken out on this home.
Original Mortgage
$253,068
Interest Rate
4.5%
Mortgage Type
FHA
Purchase Details
Closed on
Mar 9, 2007
Sold by
Montford Leslie V and Montford Karen W
Bought by
Kelly Ryan John and Kelly Joanna Kristine
Home Financials for this Owner
Home Financials are based on the most recent Mortgage that was taken out on this home.
Original Mortgage
$420,000
Interest Rate
6.29%
Mortgage Type
Purchase Money Mortgage
Purchase Details
Closed on
Apr 5, 2005
Sold by
Montford Leslie V
Bought by
Montford Leslie V and Montford Karen W
Home Financials for this Owner
Home Financials are based on the most recent Mortgage that was taken out on this home.
Original Mortgage
$280,000
Interest Rate
5.77%
Mortgage Type
New Conventional
Purchase Details
Closed on
Mar 17, 1995
Sold by
Montford Virginia E Hunt
Bought by
Montford Leslie V
Home Financials for this Owner
Home Financials are based on the most recent Mortgage that was taken out on this home.
Original Mortgage
$15,000
Interest Rate
7.74%
Mortgage Type
Seller Take Back
Create a Home Valuation Report for This Property
The Home Valuation Report is an in-depth analysis detailing your home's value as well as a comparison with similar homes in the area
Home Values in the Area
Average Home Value in this Area
Purchase History
| Date | Buyer | Sale Price | Title Company |
|---|---|---|---|
| Sabyl Myers Revocable Trust | -- | None Listed On Document | |
| Broset Sabyl Noel | -- | None Available | |
| Myers Sabyl N | $14,000 | North American Title Co Inc | |
| Myers Sabyl | -- | Chicago Title Company | |
| Myers Sabyl | -- | Chicago Title Company | |
| Myers Sabyl | -- | None Available | |
| Myers Sabyl Noel | $287,500 | Old Republic Title Company | |
| Kelly Ryan John | $525,000 | Old Republic Title Company | |
| Montford Leslie V | -- | Commonwealth Land Title Co | |
| Montford Leslie V | -- | -- |
Source: Public Records
Mortgage History
| Date | Status | Borrower | Loan Amount |
|---|---|---|---|
| Previous Owner | Myers Sabyl N | $140,000 | |
| Previous Owner | Myers Sabyl | $253,000 | |
| Previous Owner | Myers Sabyl Noel | $253,068 | |
| Previous Owner | Kelly Ryan John | $420,000 | |
| Previous Owner | Montford Leslie V | $280,000 | |
| Previous Owner | Montford Leslie V | $15,000 |
Source: Public Records
Tax History
| Year | Tax Paid | Tax Assessment Tax Assessment Total Assessment is a certain percentage of the fair market value that is determined by local assessors to be the total taxable value of land and additions on the property. | Land | Improvement |
|---|---|---|---|---|
| 2025 | $5,448 | $386,632 | $131,999 | $261,633 |
| 2024 | $5,448 | $378,916 | $129,411 | $256,505 |
| 2023 | $5,354 | $378,351 | $126,874 | $251,477 |
| 2022 | $5,265 | $363,934 | $124,387 | $246,547 |
| 2021 | $4,406 | $356,661 | $121,948 | $241,713 |
| 2020 | $4,989 | $359,933 | $120,698 | $239,235 |
| 2019 | $5,000 | $352,878 | $118,332 | $234,546 |
| 2018 | $4,881 | $345,962 | $116,013 | $229,949 |
| 2017 | $4,747 | $339,181 | $113,739 | $225,442 |
| 2016 | $4,558 | $332,531 | $111,509 | $221,022 |
| 2015 | $4,052 | $306,474 | $91,942 | $214,532 |
| 2014 | $3,977 | $300,471 | $90,141 | $210,330 |
Source: Public Records
Map
Nearby Homes
- 5637 Idlewild Ave
- 5833 Singing Hills Ave
- 2060 Broadmoor St
- 0 Dalton Ave Unit 225094100
- 1775 Rose Gate Common
- 1659 Altamar Way
- 6189 Fieldstone Dr
- 6506 Forget me Not
- 6432 Laurel Creek Place
- 5457 Treeflower Dr
- 6433 Aspenwood Way
- 6449 Aspenwood Way
- 1817 Bluebell Dr
- 883 Barney Com
- 5251 Peony Dr
- 1127 Meadow Dr
- 5473 Rainflower Dr
- 5365 Windflower Dr
- 1264 Tulip Way
- 6953 Foxtail Dr
- 5674 Firestone Rd
- 5748 Idlewild Ave
- 5747 Idlewild Ave
- 5666 Firestone Rd
- 5672 Idlewild Ave
- 5725 Idlewild Ave
- 5713 Running Hills Ave
- 5764 Idlewild Ave
- 2460 Del Monte St
- 5677 Firestone Rd
- 2482 Del Monte St
- 5671 Idlewild Ave
- 5660 Idlewild Ave
- 5727 Running Hills Ave
- 5617 Oakmont Cir
- 5669 Firestone Rd
- 5613 Oakmont Cir
- 5658 Firestone Rd
- 5810 Idlewild Ave
- 5655 Idlewild Ave
Your Personal Tour Guide
Ask me questions while you tour the home.