5679 Mouzon Dr Columbus, OH 43232
East Columbus-White Ash NeighborhoodEstimated Value: $323,000 - $365,194
About This Home
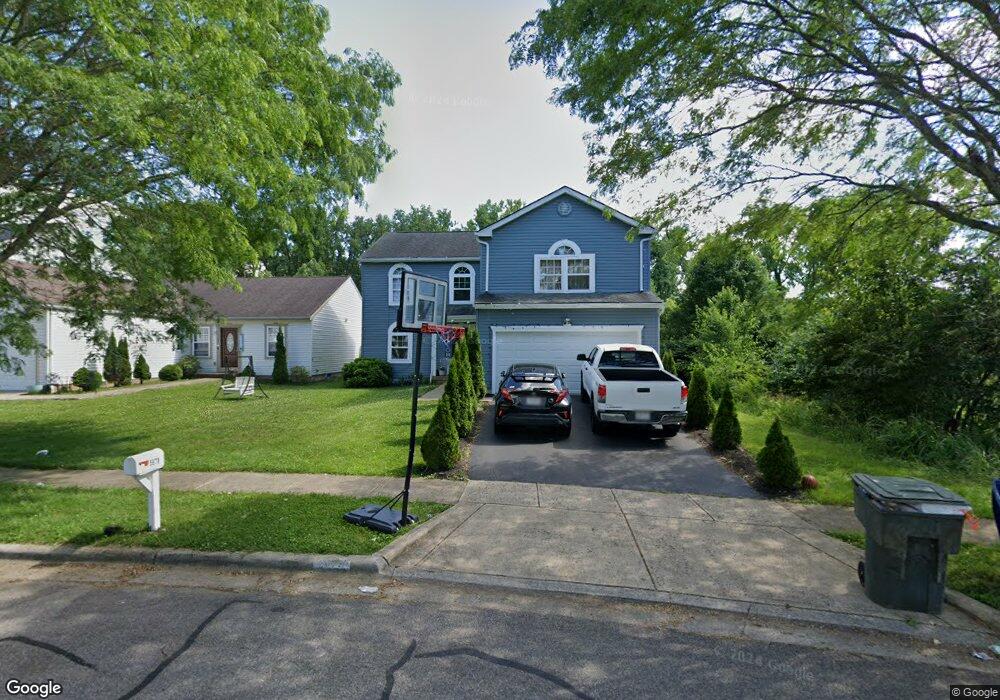
This home is located at 5679 Mouzon Dr, Columbus, OH 43232 and is currently estimated at $344,549, approximately $130 per square foot. 5679 Mouzon Dr is a home located in Franklin County with nearby schools including Liberty Elementary School, Yorktown Middle School, and Independence High School.
Ownership History
We collect this data history from publicly available records. To have your information removed, we recommend requesting removal directly through your county’s website.
Purchase Details
Purchase Details
Purchase Details
Purchase Details
Purchase Details
Home Financials for this Owner
Home Financials are based on the most recent Mortgage that was taken out on this home.Purchase Details
Home Values in the Area
Average Home Value in this Area
Purchase History
We collect this data history from publicly available records. To have your information removed, we recommend requesting removal directly through your county’s website.
| Date | Buyer | Sale Price | Title Company |
|---|---|---|---|
| $41,150 | Attorney | ||
| -- | Nova Title | ||
| -- | None Available | ||
| -- | Independent Title Box | ||
| $162,500 | Chicago Title | ||
| $1,695,000 | -- |
Mortgage History
We collect this data history from publicly available records. To have your information removed, we recommend requesting removal directly through your county’s website.
| Date | Status | Borrower | Loan Amount |
|---|---|---|---|
| Previous Owner | $161,131 |
Tax History
We collect this data history from publicly available records. To have your information removed, we recommend requesting removal directly through your county’s website.
| Year | Tax Paid | Tax Assessment Tax Assessment Total Assessment is a certain percentage of the fair market value that is determined by local assessors to be the total taxable value of land and additions on the property. | Land | Improvement |
|---|---|---|---|---|
| 2025 | $4,965 | $110,640 | $23,280 | $87,360 |
| 2024 | $4,965 | $110,640 | $23,280 | $87,360 |
| 2023 | $4,902 | $110,635 | $23,275 | $87,360 |
| 2022 | $3,638 | $70,140 | $6,300 | $63,840 |
| 2021 | $3,644 | $70,140 | $6,300 | $63,840 |
| 2020 | $3,649 | $70,140 | $6,300 | $63,840 |
| 2019 | $3,512 | $57,890 | $5,250 | $52,640 |
| 2018 | $1,752 | $57,890 | $5,250 | $52,640 |
| 2017 | $3,567 | $57,890 | $5,250 | $52,640 |
| 2016 | $3,624 | $54,150 | $5,850 | $48,300 |
| 2015 | $1,675 | $54,150 | $5,850 | $48,300 |
| 2014 | $3,357 | $54,150 | $5,850 | $48,300 |
| 2013 | $1,990 | $63,665 | $6,860 | $56,805 |
Map
- 5691 Matuka Dr
- 5939 Morrissey St
- 5465 Argo Ln
- 5882 Abernathy Ln Unit 5882F
- 3273 Calveylee Ln
- 3267 Calveylee Ln
- 5951 Morrissey St
- 3261 Calveylee Ln
- 3274 Calveylee Ln
- 3268 Calveylee Ln
- 3262 Calveylee Ln
- 3328 Everson Rd E
- 5946 Abernathy Ln
- 5960 Abernathy Ln
- 5962 Abernathy Ln
- 5968 Abernathy Ln
- 5970 Abernathy Ln
- 5976 Abernathy Ln
- 5978 Abernathy Ln
- 5383 Chaumonte Ave
Ask me questions while you tour the home.