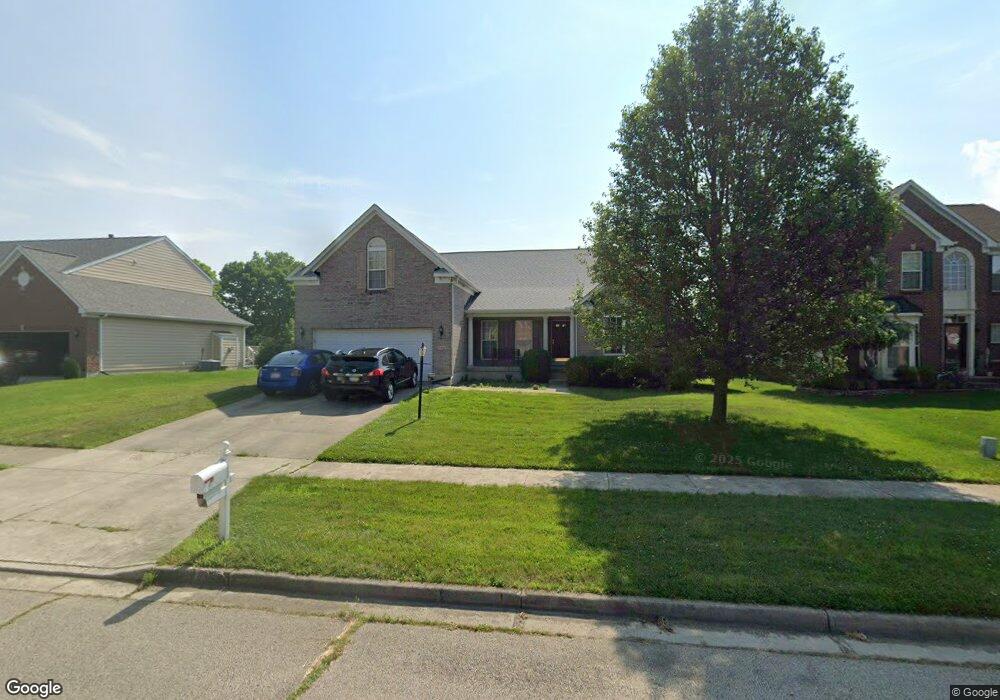
568 Ashbury Farms Dr Vandalia, OH 45377
Estimated Value: $505,828 - $540,000
4
Beds
4
Baths
4,078
Sq Ft
$129/Sq Ft
Est. Value
About This Home
This home is located at 568 Ashbury Farms Dr, Vandalia, OH 45377 and is currently estimated at $526,207, approximately $129 per square foot. 568 Ashbury Farms Dr is a home located in Montgomery County with nearby schools including Helke Elementary School, Morton Middle School, and Butler High School.
Ownership History
Date
Name
Owned For
Owner Type
Purchase Details
Closed on
Sep 9, 2011
Sold by
Poe Don R and Poe Kimberly B
Bought by
Uffindell Barry P and Uffindell Sonya L
Current Estimated Value
Home Financials for this Owner
Home Financials are based on the most recent Mortgage that was taken out on this home.
Original Mortgage
$23,200
Outstanding Balance
$13,228
Interest Rate
4.32%
Mortgage Type
Credit Line Revolving
Estimated Equity
$512,979
Purchase Details
Closed on
Feb 14, 2005
Sold by
Nvr Inc
Bought by
Poe Don R and Poe Kimberly B
Home Financials for this Owner
Home Financials are based on the most recent Mortgage that was taken out on this home.
Original Mortgage
$165,217
Interest Rate
5.8%
Mortgage Type
Fannie Mae Freddie Mac
Purchase Details
Closed on
Nov 17, 2004
Sold by
Arnold Enterprises Inc
Bought by
Nvr Inc
Create a Home Valuation Report for This Property
The Home Valuation Report is an in-depth analysis detailing your home's value as well as a comparison with similar homes in the area
Home Values in the Area
Average Home Value in this Area
Purchase History
| Date | Buyer | Sale Price | Title Company |
|---|---|---|---|
| Uffindell Barry P | $232,000 | None Available | |
| Poe Don R | $275,300 | None Available | |
| Nvr Inc | $45,000 | First Title Agency Inc |
Source: Public Records
Mortgage History
| Date | Status | Borrower | Loan Amount |
|---|---|---|---|
| Open | Uffindell Barry P | $23,200 | |
| Open | Uffindell Barry P | $185,600 | |
| Closed | Poe Don R | $165,217 |
Source: Public Records
Tax History Compared to Growth
Tax History
| Year | Tax Paid | Tax Assessment Tax Assessment Total Assessment is a certain percentage of the fair market value that is determined by local assessors to be the total taxable value of land and additions on the property. | Land | Improvement |
|---|---|---|---|---|
| 2024 | $7,437 | $142,960 | $17,640 | $125,320 |
| 2023 | $7,437 | $142,960 | $17,640 | $125,320 |
| 2022 | $7,287 | $113,300 | $14,000 | $99,300 |
| 2021 | $7,293 | $113,300 | $14,000 | $99,300 |
| 2020 | $7,272 | $113,300 | $14,000 | $99,300 |
| 2019 | $7,227 | $103,230 | $14,000 | $89,230 |
| 2018 | $7,241 | $103,230 | $14,000 | $89,230 |
| 2017 | $7,187 | $103,230 | $14,000 | $89,230 |
| 2016 | $6,446 | $90,960 | $14,000 | $76,960 |
| 2015 | $6,365 | $90,960 | $14,000 | $76,960 |
| 2014 | $6,365 | $90,960 | $14,000 | $76,960 |
| 2012 | -- | $97,530 | $17,500 | $80,030 |
Source: Public Records
Map
Nearby Homes
- 1515 Ash Ridge Ct
- 1588 Middle Park Dr
- 1441 S Dixie Dr
- 1054 Wilhelmina Dr
- 1052 Forest Crest Place
- 246 Crest Hill Ave
- 696 W Alkaline Springs Rd
- 917 Howard Ln
- 3600 Little York Rd
- 1201 Greystone Cir
- 416 Bent Twig Dr
- 3518 Park Crest Ln
- 469 Farrell Rd
- Johnstown Plan at Yorkshire Reserve - The Oaks
- Newcastle Plan at Yorkshire Reserve - The Oaks
- Bellamy Plan at Yorkshire Reserve - The Oaks
- Milford Plan at Yorkshire Reserve - The Oaks
- Holcombe Plan at Yorkshire Reserve - The Oaks
- Chatham Plan at Yorkshire Reserve - The Oaks
- 461 Poplar Grove Dr
- 582 Ashbury Farms Dr
- 554 Ashbury Farms Dr
- 1643 Ashley Place
- 540 Ashbury Farms Dr
- 1741 Ashworth Dr
- 1735 Ashworth Dr Unit FARMS
- 1735 Ashworth Dr
- 575 Ashbury Farms Dr
- 1727 Ashworth Dr
- 559 Ashbury Farms Dr
- 585 Ashbury Farms Dr
- 1619 Ashley Place
- 526 Ashbury Farms Dr
- 547 Ashbury Farms Dr
- 595 Ashbury Farms Dr
- 1719 Ashworth Dr
- 1655 Ashley Place
- 1605 Ashley Place
- 533 Ashbury Farms Dr
- 512 Ashbury Farms Dr