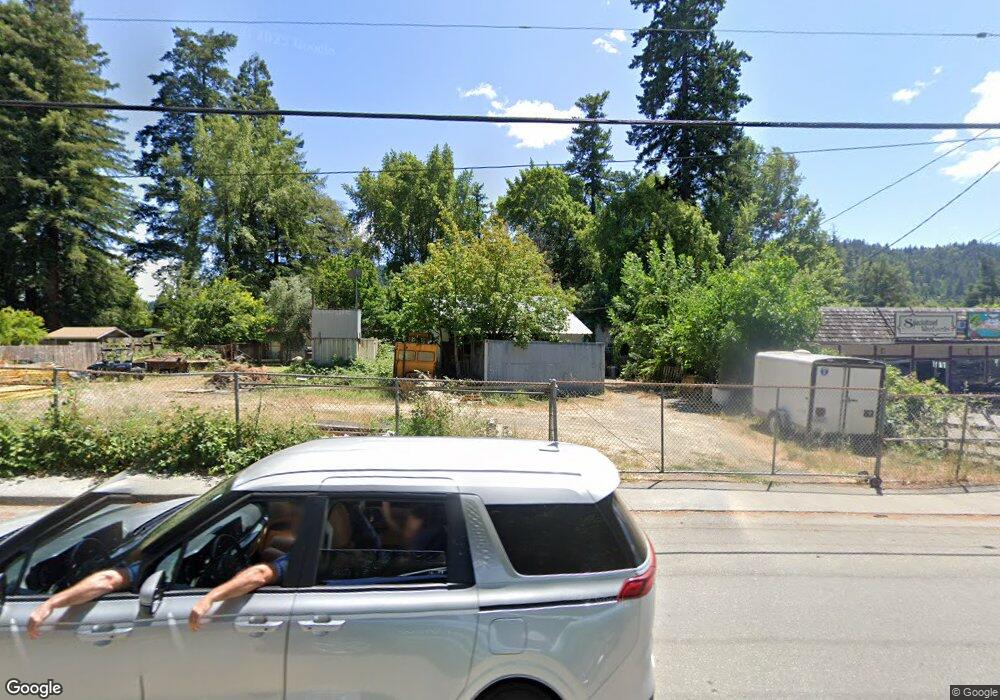
568 Briceland Rd Redway, CA 95560
Redway NeighborhoodEstimated Value: $166,502 - $504,000
--
Bed
--
Bath
--
Sq Ft
0.32
Acres
About This Home
This home is located at 568 Briceland Rd, Redway, CA 95560 and is currently estimated at $296,626. 568 Briceland Rd is a home.
Ownership History
Date
Name
Owned For
Owner Type
Purchase Details
Closed on
Dec 6, 2024
Sold by
Harper Brian S and Harper Zuma Dale
Bought by
Harper Zuma Dale
Current Estimated Value
Purchase Details
Closed on
Sep 11, 2008
Sold by
Harper Brian S
Bought by
Harper Brian S
Purchase Details
Closed on
Oct 22, 2002
Sold by
Davenport Caroline Ann and Scruggs Reed Bradford
Bought by
Harper Brian S
Home Financials for this Owner
Home Financials are based on the most recent Mortgage that was taken out on this home.
Original Mortgage
$60,000
Interest Rate
5.86%
Mortgage Type
Seller Take Back
Create a Home Valuation Report for This Property
The Home Valuation Report is an in-depth analysis detailing your home's value as well as a comparison with similar homes in the area
Home Values in the Area
Average Home Value in this Area
Purchase History
| Date | Buyer | Sale Price | Title Company |
|---|---|---|---|
| Harper Zuma Dale | -- | None Listed On Document | |
| Harper Zuma Dale | -- | None Listed On Document | |
| Harper Brian S | -- | None Available | |
| Harper Brian S | $75,000 | Fidelity National |
Source: Public Records
Mortgage History
| Date | Status | Borrower | Loan Amount |
|---|---|---|---|
| Previous Owner | Harper Brian S | $60,000 |
Source: Public Records
Tax History Compared to Growth
Tax History
| Year | Tax Paid | Tax Assessment Tax Assessment Total Assessment is a certain percentage of the fair market value that is determined by local assessors to be the total taxable value of land and additions on the property. | Land | Improvement |
|---|---|---|---|---|
| 2025 | $1,264 | $108,604 | $104,268 | $4,336 |
| 2024 | $1,264 | $106,475 | $102,224 | $4,251 |
| 2023 | $1,269 | $104,388 | $100,220 | $4,168 |
| 2022 | $1,251 | $102,342 | $98,255 | $4,087 |
| 2021 | $1,207 | $100,336 | $96,329 | $4,007 |
| 2020 | $1,213 | $99,308 | $95,342 | $3,966 |
| 2019 | $1,185 | $97,362 | $93,473 | $3,889 |
| 2018 | $1,166 | $95,454 | $91,641 | $3,813 |
| 2017 | $1,146 | $93,584 | $89,845 | $3,739 |
| 2016 | $1,140 | $91,750 | $88,084 | $3,666 |
| 2015 | -- | $90,372 | $86,761 | $3,611 |
| 2014 | -- | $88,603 | $85,062 | $3,541 |
Source: Public Records
Map
Nearby Homes
- 815 Briceland Rd
- 95 Oak Ave
- 260 Redway Dr
- 46 Cedar Ln
- 75 Empire Ave
- 64 Pacific Ave
- 421 Par Ave
- 548 Forest Dr
- 478 Redway Dr
- 44 Mckenzie Ln
- 176 Rusk Ln
- 416 Birdie Ln
- 87 Manzanita Ave
- 3167 Redwood Dr
- 146 & 106 Barnes Ln
- 77 Mill Rd
- 2611 Redwood Dr
- 4001 Old Briceland Rd
- 0 Connick Creek Rd
- 575 Connick Creek Rd
- 201 Madrone Ave
- 241 Madrone Ave
- 530 Briceland Thorn Rd
- 183 Madrone Ave
- 289 Madrone Ave
- 498 Briceland Rd
- 23 Redway Dr
- 135 Madrone Ave
- 529 Briceland Rd
- 135 Redway Dr
- 529 Briceland Thorn Rd
- 111 Madrone Ave
- 479 Briceland-Thorne Rd
- 138 Madrone Ave
- 23 Orchard Ln
- 44 Redway Dr
- 155 Redway Dr
- 136 Redway Dr
- 74 Redway Dr
- 100 Redway Dr