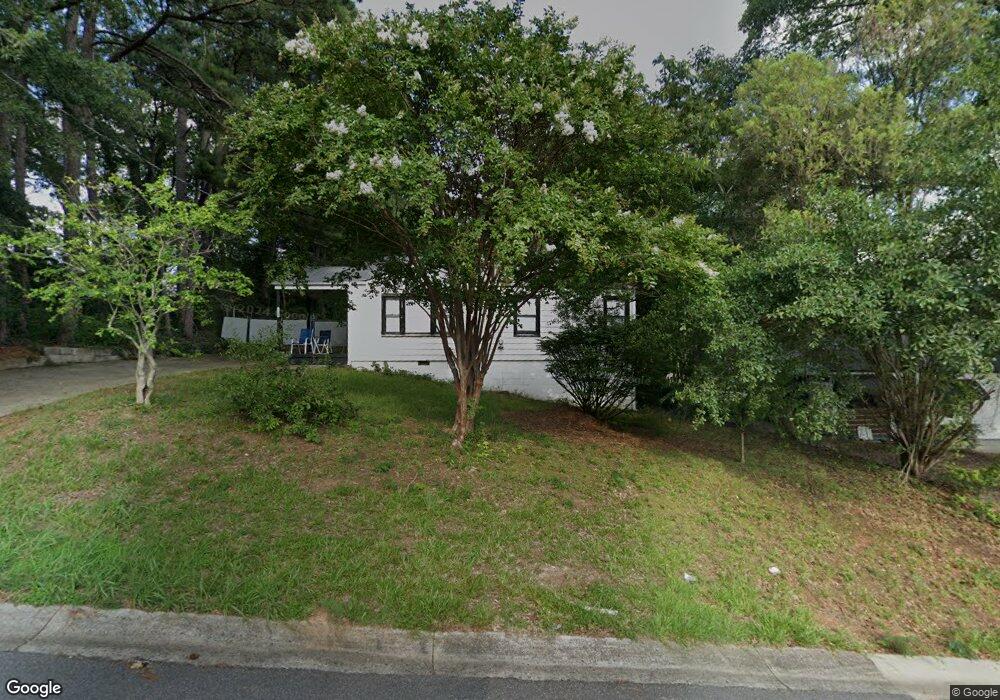
568 Custer St NE Marietta, GA 30060
Estimated Value: $181,000 - $353,000
2
Beds
1
Bath
816
Sq Ft
$355/Sq Ft
Est. Value
About This Home
This home is located at 568 Custer St NE, Marietta, GA 30060 and is currently estimated at $289,705, approximately $355 per square foot. 568 Custer St NE is a home located in Cobb County with nearby schools including Marietta Sixth Grade Academy, Sawyer Road Elementary School, and Marietta Middle School.
Ownership History
Date
Name
Owned For
Owner Type
Purchase Details
Closed on
Apr 27, 2021
Sold by
Wilches Hernando Fonseca
Bought by
Wilches Hernando Fonseca and Bejarano Geirson J
Current Estimated Value
Home Financials for this Owner
Home Financials are based on the most recent Mortgage that was taken out on this home.
Original Mortgage
$101,600
Outstanding Balance
$91,931
Interest Rate
3%
Mortgage Type
New Conventional
Estimated Equity
$197,774
Purchase Details
Closed on
Aug 9, 2019
Sold by
Andrews Dorothy L Estate
Bought by
Hre Investments Llc
Home Financials for this Owner
Home Financials are based on the most recent Mortgage that was taken out on this home.
Original Mortgage
$85,000
Interest Rate
3.7%
Mortgage Type
New Conventional
Purchase Details
Closed on
Apr 9, 2003
Sold by
Andrews William D
Bought by
Andrews Dorothy L
Home Financials for this Owner
Home Financials are based on the most recent Mortgage that was taken out on this home.
Original Mortgage
$61,882
Interest Rate
5.74%
Mortgage Type
New Conventional
Create a Home Valuation Report for This Property
The Home Valuation Report is an in-depth analysis detailing your home's value as well as a comparison with similar homes in the area
Home Values in the Area
Average Home Value in this Area
Purchase History
| Date | Buyer | Sale Price | Title Company |
|---|---|---|---|
| Wilches Hernando Fonseca | -- | None Available | |
| Hre Investments Llc | $85,000 | -- | |
| Andrews Dorothy L | -- | -- |
Source: Public Records
Mortgage History
| Date | Status | Borrower | Loan Amount |
|---|---|---|---|
| Open | Wilches Hernando Fonseca | $101,600 | |
| Closed | Hre Investments Llc | $85,000 | |
| Previous Owner | Andrews Dorothy L | $61,882 |
Source: Public Records
Tax History Compared to Growth
Tax History
| Year | Tax Paid | Tax Assessment Tax Assessment Total Assessment is a certain percentage of the fair market value that is determined by local assessors to be the total taxable value of land and additions on the property. | Land | Improvement |
|---|---|---|---|---|
| 2024 | $886 | $104,704 | $62,584 | $42,120 |
| 2023 | $770 | $91,064 | $54,424 | $36,640 |
| 2022 | $765 | $90,376 | $65,256 | $25,120 |
| 2021 | $498 | $58,000 | $38,560 | $19,440 |
| 2020 | $292 | $34,000 | $22,320 | $11,680 |
| 2019 | $329 | $38,344 | $25,200 | $13,144 |
| 2018 | $306 | $35,640 | $23,520 | $12,120 |
| 2017 | $211 | $30,600 | $18,480 | $12,120 |
| 2016 | $188 | $27,240 | $15,120 | $12,120 |
| 2015 | $156 | $20,784 | $11,760 | $9,024 |
| 2014 | $86 | $20,784 | $0 | $0 |
Source: Public Records
Map
Nearby Homes
- 560 Custer St NE
- 581 Marian St
- 604 Seminole Dr NE
- 610 Seminole Dr NE
- 624 Seminole Place
- 570 Seminole Dr NE
- 630 Seminole Place
- 611 Cobb Pkwy N
- 560 N Fairground St NE
- 526 Marian St NE
- 625 Riverside Dr NE
- 640 Seminole Dr NE
- 631 Riverside Dr NE
- 639 Riverside Dr NE
- 550 Seminole Dr NE
- 661 Riverside Dr NE
- 516 N Fairground St NE Unit D
- 516 N Fairground St NE Unit F
- 516 N Fairground St NE Unit E
- 516 N Fairground St NE