Estimated Value: $160,000 - $192,000
4
Beds
2
Baths
1,240
Sq Ft
$146/Sq Ft
Est. Value
About This Home
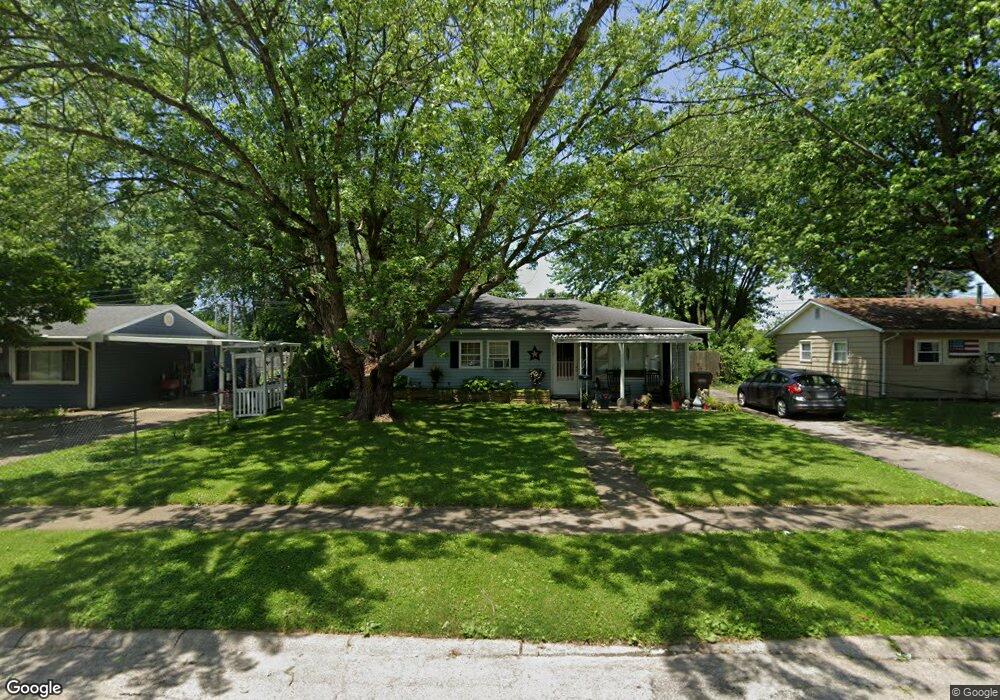
This home is located at 568 Sheelin Rd, Xenia, OH 45385 and is currently estimated at $180,758, approximately $145 per square foot. 568 Sheelin Rd is a home located in Greene County with nearby schools including Xenia High School, Summit Academy Community School for Alternative Learners - Xenia, and Legacy Christian Academy.
Ownership History
Date
Name
Owned For
Owner Type
Purchase Details
Closed on
Feb 21, 2014
Sold by
Johnson Verena A
Bought by
Johnson Brian Lee
Current Estimated Value
Purchase Details
Closed on
Nov 19, 2013
Sold by
Johnson Forrest R and Johnson Verena A
Bought by
Johnson Verena A and Johnson Brian Lee
Purchase Details
Closed on
Nov 29, 2011
Sold by
Household Realty Corporation
Bought by
Johnson Forest R and Johnson Verena A
Purchase Details
Closed on
Nov 17, 2011
Sold by
Pyles Deborah L and Pyles Debra L
Bought by
Household Realty Corporation
Purchase Details
Closed on
Jul 25, 1995
Sold by
Doris J Dewitte Est
Bought by
Pyles Debra L
Home Financials for this Owner
Home Financials are based on the most recent Mortgage that was taken out on this home.
Original Mortgage
$20,000
Interest Rate
8.75%
Mortgage Type
New Conventional
Create a Home Valuation Report for This Property
The Home Valuation Report is an in-depth analysis detailing your home's value as well as a comparison with similar homes in the area
Home Values in the Area
Average Home Value in this Area
Purchase History
| Date | Buyer | Sale Price | Title Company |
|---|---|---|---|
| Johnson Brian Lee | -- | None Available | |
| Johnson Verena A | -- | None Available | |
| Johnson Forest R | $34,000 | Omega Title Agency Llc | |
| Household Realty Corporation | $48,000 | None Available | |
| Pyles Debra L | $55,000 | -- |
Source: Public Records
Mortgage History
| Date | Status | Borrower | Loan Amount |
|---|---|---|---|
| Previous Owner | Pyles Debra L | $20,000 |
Source: Public Records
Tax History Compared to Growth
Tax History
| Year | Tax Paid | Tax Assessment Tax Assessment Total Assessment is a certain percentage of the fair market value that is determined by local assessors to be the total taxable value of land and additions on the property. | Land | Improvement |
|---|---|---|---|---|
| 2024 | $1,887 | $44,090 | $9,170 | $34,920 |
| 2023 | $1,887 | $44,090 | $9,170 | $34,920 |
| 2022 | $1,555 | $30,990 | $6,550 | $24,440 |
| 2021 | $1,576 | $30,990 | $6,550 | $24,440 |
| 2020 | $1,510 | $30,990 | $6,550 | $24,440 |
| 2019 | $1,199 | $23,180 | $4,550 | $18,630 |
| 2018 | $1,204 | $23,180 | $4,550 | $18,630 |
| 2017 | $1,191 | $23,180 | $4,550 | $18,630 |
| 2016 | $1,135 | $21,440 | $4,550 | $16,890 |
| 2015 | $1,138 | $21,440 | $4,550 | $16,890 |
| 2014 | $545 | $21,440 | $4,550 | $16,890 |
Source: Public Records
Map
Nearby Homes
- 343 Sheelin Rd
- 912 Omard Dr
- 883 Omard Dr
- 1351 Omard Dr
- 509 Antrim Rd
- 1223 June Dr
- 1233 June Dr
- 1283 June Dr
- 1391 June Dr
- 613 N West St
- 1342 Kylemore Dr
- 516 N King St
- 137 Pleasant St
- 659 N King St
- 878 N Detroit St
- 902 N Detroit St
- 523 Hollywood Blvd
- Harmony Plan at Grandstone Trace
- Newcastle Plan at Grandstone Trace
- Pendleton Plan at Grandstone Trace