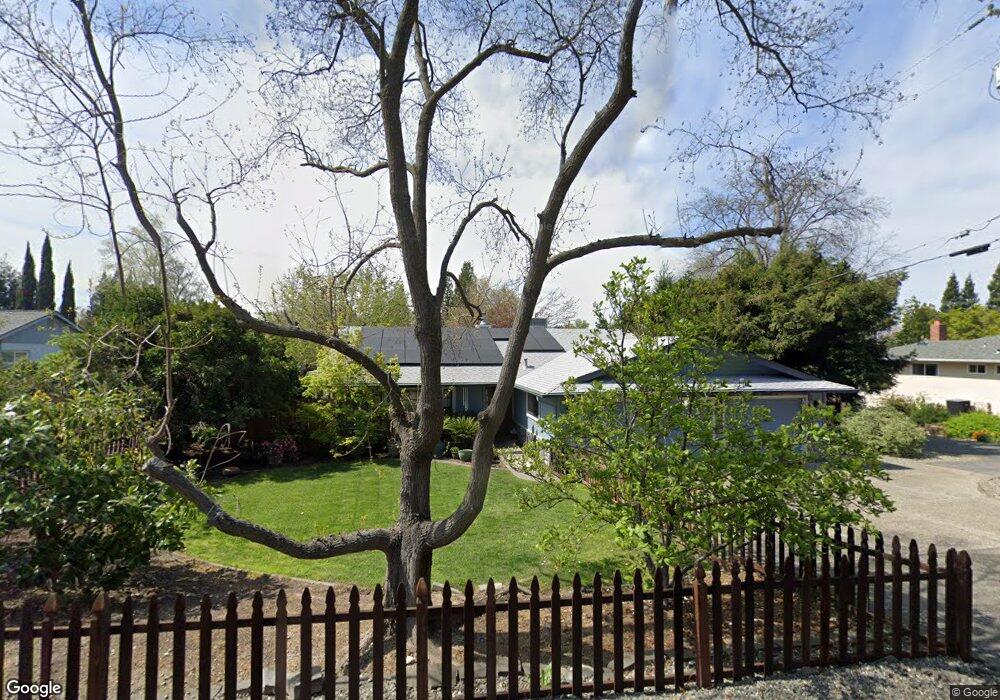
5680 Foothill Rd Rocklin, CA 95677
Secret Ravine-Sierra Bluff NeighborhoodEstimated Value: $459,000 - $687,500
4
Beds
2
Baths
2,097
Sq Ft
$297/Sq Ft
Est. Value
About This Home
This home is located at 5680 Foothill Rd, Rocklin, CA 95677 and is currently estimated at $622,375, approximately $296 per square foot. 5680 Foothill Rd is a home located in Placer County with nearby schools including Sierra Elementary School, Spring View Middle School, and Whitney High.
Ownership History
Date
Name
Owned For
Owner Type
Purchase Details
Closed on
Mar 8, 2018
Sold by
Tomita Naimi
Bought by
Tomita Naomi
Current Estimated Value
Purchase Details
Closed on
Jan 3, 2013
Sold by
Fix Linda
Bought by
Tomita Naomi
Home Financials for this Owner
Home Financials are based on the most recent Mortgage that was taken out on this home.
Original Mortgage
$125,000
Outstanding Balance
$23,680
Interest Rate
3.27%
Mortgage Type
New Conventional
Estimated Equity
$598,695
Purchase Details
Closed on
Mar 23, 2004
Sold by
Tomita Naomi and Fix Linda
Bought by
Tomita Naomi and Fix Linda
Home Financials for this Owner
Home Financials are based on the most recent Mortgage that was taken out on this home.
Original Mortgage
$175,000
Interest Rate
5.64%
Mortgage Type
New Conventional
Purchase Details
Closed on
Jul 26, 2002
Sold by
Beaton Janis K and Beaton Phillip J
Bought by
Fix Linda and Tomita Naomi
Home Financials for this Owner
Home Financials are based on the most recent Mortgage that was taken out on this home.
Original Mortgage
$174,000
Interest Rate
6.6%
Create a Home Valuation Report for This Property
The Home Valuation Report is an in-depth analysis detailing your home's value as well as a comparison with similar homes in the area
Home Values in the Area
Average Home Value in this Area
Purchase History
| Date | Buyer | Sale Price | Title Company |
|---|---|---|---|
| Tomita Naomi | -- | None Available | |
| Tomita Naomi | -- | Placer Title Company | |
| Tomita Naomi | -- | Alliance Title | |
| Fix Linda | $299,000 | Old Republic Title Company |
Source: Public Records
Mortgage History
| Date | Status | Borrower | Loan Amount |
|---|---|---|---|
| Open | Tomita Naomi | $125,000 | |
| Previous Owner | Tomita Naomi | $175,000 | |
| Previous Owner | Fix Linda | $174,000 |
Source: Public Records
Tax History
| Year | Tax Paid | Tax Assessment Tax Assessment Total Assessment is a certain percentage of the fair market value that is determined by local assessors to be the total taxable value of land and additions on the property. | Land | Improvement |
|---|---|---|---|---|
| 2025 | $4,280 | $401,224 | $116,960 | $284,264 |
| 2023 | $4,280 | $385,646 | $112,419 | $273,227 |
| 2022 | $4,139 | $378,085 | $110,215 | $267,870 |
| 2021 | $4,093 | $370,672 | $108,054 | $262,618 |
| 2020 | $4,086 | $366,873 | $106,947 | $259,926 |
| 2019 | $4,029 | $359,680 | $104,850 | $254,830 |
| 2018 | $3,923 | $352,629 | $102,795 | $249,834 |
| 2017 | $3,896 | $345,716 | $100,780 | $244,936 |
| 2016 | $3,782 | $338,938 | $98,804 | $240,134 |
| 2015 | $3,734 | $333,847 | $97,320 | $236,527 |
| 2014 | $3,123 | $279,500 | $81,800 | $197,700 |
Source: Public Records
Map
Nearby Homes
- 5853 Brookshire Dr
- 5033 Saint Francis Way
- 5993 Green Mountain Ln
- 0 Ambassador Dr Unit 226003540
- 6206 Barrington Hills Dr
- 4466 Greenbrae Rd
- 6008 Equestrian Terrace
- 5500 China Garden Rd
- 4271 Fernwood St
- 4305 Fernwood St Unit 44
- 4279 Fernwood St Unit 39
- 4298 Oakwood St
- 4275 Fernwood St
- 5950 Tanus Cir
- Residence Four Plan at Granite Terrace
- Residence One Plan at Granite Terrace
- Residence Two Plan at Granite Terrace
- Residence Three Plan at Granite Terrace
- 4401 Redstart Ln Unit Lot01
- 4400 Redstart Ln Unit Lot16
- 5660 Foothill Rd
- 5690 Foothill Rd
- 4780 Paradise Ct
- 4770 Paradise Ct
- 4758 Robin Ct
- 5693 Foothill Rd
- 4934 El Ranchero Ct
- 5700 Foothill Rd
- 4930 El Ranchero Ct
- 4758 Paradise Ct
- 4926 El Cid Dr
- 4760 Paradise Ct
- 5625 Foothill Rd
- 4801 Buxton Way
- 4765 Robin Ct
- 4748 Robin Ct
- 5600 Foothill Rd
- 4922 El Cid Dr
- 4750 Paradise Ct
- 4852 El Verde Ct