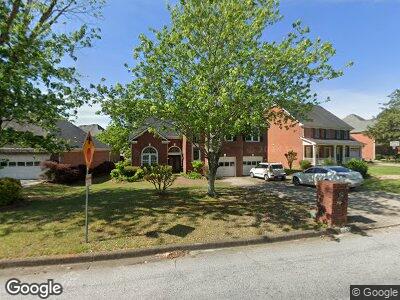
5683 Southland Dr Unit 1 Stone Mountain, GA 30087
Stone Mountain NeighborhoodEstimated Value: $366,000 - $443,000
4
Beds
3
Baths
3,515
Sq Ft
$113/Sq Ft
Est. Value
About This Home
This home is located at 5683 Southland Dr Unit 1, Stone Mountain, GA 30087 and is currently estimated at $398,232, approximately $113 per square foot. 5683 Southland Dr Unit 1 is a home located in DeKalb County with nearby schools including Shadow Rock Elementary School, Redan Middle School, and Redan High School.
Ownership History
Date
Name
Owned For
Owner Type
Purchase Details
Closed on
Oct 25, 2002
Sold by
Vinson Marvin B
Bought by
Vinson Marvin B and Vinson Cordelia Y
Current Estimated Value
Home Financials for this Owner
Home Financials are based on the most recent Mortgage that was taken out on this home.
Original Mortgage
$27,000
Interest Rate
6.3%
Mortgage Type
Credit Line Revolving
Purchase Details
Closed on
Nov 26, 1997
Sold by
The Ryland Group Inc
Bought by
Vinson Bell M and Vinson Cordelia Y
Home Financials for this Owner
Home Financials are based on the most recent Mortgage that was taken out on this home.
Original Mortgage
$173,150
Interest Rate
7.38%
Mortgage Type
VA
Create a Home Valuation Report for This Property
The Home Valuation Report is an in-depth analysis detailing your home's value as well as a comparison with similar homes in the area
Home Values in the Area
Average Home Value in this Area
Purchase History
| Date | Buyer | Sale Price | Title Company |
|---|---|---|---|
| Vinson Marvin B | -- | -- | |
| Vinson Marvin B | -- | -- | |
| Vinson Bell M | $168,200 | -- |
Source: Public Records
Mortgage History
| Date | Status | Borrower | Loan Amount |
|---|---|---|---|
| Open | Vinson Marvin Bell | $135,000 | |
| Closed | Vinson Marvin Bell | $30,000 | |
| Closed | Vinson Marvin Bell | $130,300 | |
| Closed | Vinson Marvin B | $30,500 | |
| Closed | Vinson Marvin B | $28,400 | |
| Closed | Vinson Marvin B | $21,381 | |
| Closed | Vinson Marvin B | $27,000 | |
| Closed | Vinson Marvin B | $179,200 | |
| Previous Owner | Vinson Bell M | $18,000 | |
| Previous Owner | Vinson Bell M | $173,150 |
Source: Public Records
Tax History Compared to Growth
Tax History
| Year | Tax Paid | Tax Assessment Tax Assessment Total Assessment is a certain percentage of the fair market value that is determined by local assessors to be the total taxable value of land and additions on the property. | Land | Improvement |
|---|---|---|---|---|
| 2023 | $4,444 | $156,720 | $17,200 | $139,520 |
| 2022 | $4,053 | $127,360 | $17,200 | $110,160 |
| 2021 | $3,522 | $104,360 | $17,200 | $87,160 |
| 2020 | $3,273 | $95,760 | $17,200 | $78,560 |
| 2019 | $3,004 | $88,960 | $17,200 | $71,760 |
| 2018 | $2,439 | $79,800 | $17,200 | $62,600 |
| 2017 | $2,689 | $76,920 | $17,200 | $59,720 |
| 2016 | $2,562 | $75,160 | $17,200 | $57,960 |
| 2014 | $2,004 | $59,360 | $4,960 | $54,400 |
Source: Public Records
Map
Nearby Homes
- 5633 Southland Dr
- 5610 Mountain Meadow Ct Unit 11
- 690 Gateway Ct Unit 1
- 5611 Manassas Run
- 818 Mountain View Run
- 5786 Longbow Dr
- 5594 Mountain View Pass
- 5705 Mountain Crescent
- 563 Navarre Dr
- 800 S Stone Mountain Lithonia Rd
- 5960 Magnolia Ridge
- 5581 Shadow Rock Dr
- 554 Sherwood Oaks Rd
- 5607 Stonington Trace Pkwy
- 5751 Wells Cir
- 5632 Stonington Trace Pkwy
- 5917 Southland Dr
- 5683 Southland Dr Unit 1
- 5673 Southland Dr
- 5691 Southland Dr Unit 1
- 5672 Mountain Meadow Ct
- 5665 Southland Dr
- 5705 Southland Dr Unit 6
- 710 Mountain Meadow Walk Unit XI
- 685 Antietam Dr
- 5664 Moutain Meadow
- 5664 Moutain Meadow Dr
- 5664 Mountain Meadow Ct Unit XI
- 5694 Southland Dr
- 5674 Southland Dr
- 5659 Southland Dr Unit 1
- 5659 Southland Dr
- 5659 Southland Dr Unit 17
- 684 Appomattox Trace
- 0 Mountain Meadow Unit 8652629
- 0 Mountain Meadow Unit 8372832
- 0 Mountain Meadow Unit 7558031