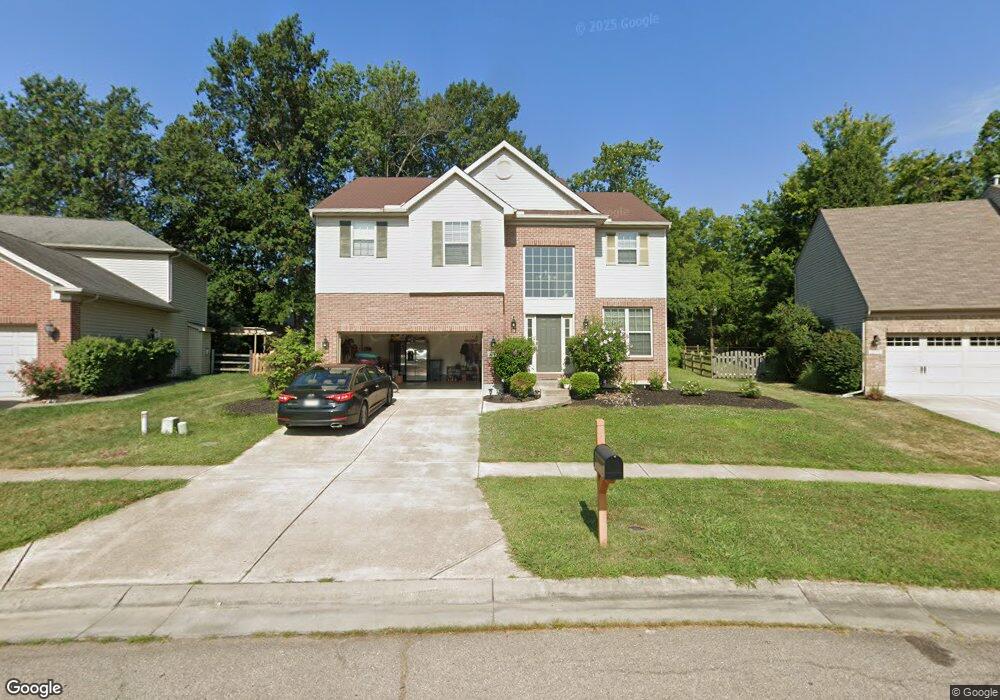
5683 Wyntree Ct Maineville, OH 45039
Estimated Value: $387,764 - $405,000
4
Beds
3
Baths
2,184
Sq Ft
$182/Sq Ft
Est. Value
About This Home
This home is located at 5683 Wyntree Ct, Maineville, OH 45039 and is currently estimated at $397,441, approximately $181 per square foot. 5683 Wyntree Ct is a home located in Warren County with nearby schools including Little Miami Early Childhood Center, Little Miami Intermediate Middle School, and Little Miami Middle School.
Ownership History
Date
Name
Owned For
Owner Type
Purchase Details
Closed on
Apr 30, 2020
Sold by
Nieman Mark and Kuhn Jennifer
Bought by
Nieman Jennifer L
Current Estimated Value
Home Financials for this Owner
Home Financials are based on the most recent Mortgage that was taken out on this home.
Original Mortgage
$152,000
Outstanding Balance
$132,936
Interest Rate
3.2%
Mortgage Type
New Conventional
Estimated Equity
$264,505
Purchase Details
Closed on
Dec 28, 2012
Sold by
Nieman Mark C and Nieman Jennifer L
Bought by
Nieman Mark C and Nieman Jennifer L
Home Financials for this Owner
Home Financials are based on the most recent Mortgage that was taken out on this home.
Original Mortgage
$177,500
Interest Rate
3.3%
Mortgage Type
New Conventional
Purchase Details
Closed on
Jun 11, 2010
Sold by
Forty One Corporation
Bought by
Nieman Mark C and Kuhn Jennifer L
Home Financials for this Owner
Home Financials are based on the most recent Mortgage that was taken out on this home.
Original Mortgage
$182,541
Interest Rate
5.25%
Mortgage Type
FHA
Purchase Details
Closed on
Jan 21, 2010
Sold by
Meyer Builders Douglas Homes Ltd
Bought by
The Huntington National Bank
Purchase Details
Closed on
Mar 26, 2004
Sold by
Turning Leaf Llc
Bought by
Meyer Builders Douglas Homes Ltd
Create a Home Valuation Report for This Property
The Home Valuation Report is an in-depth analysis detailing your home's value as well as a comparison with similar homes in the area
Home Values in the Area
Average Home Value in this Area
Purchase History
| Date | Buyer | Sale Price | Title Company |
|---|---|---|---|
| Nieman Jennifer L | -- | Servicelink | |
| Nieman Mark C | -- | Cincinnatus Title | |
| Nieman Mark C | $185,000 | Imperial Title Services | |
| The Huntington National Bank | $151,000 | None Available | |
| Meyer Builders Douglas Homes Ltd | $182,733 | First Title Agency Inc |
Source: Public Records
Mortgage History
| Date | Status | Borrower | Loan Amount |
|---|---|---|---|
| Open | Nieman Jennifer L | $152,000 | |
| Closed | Nieman Mark C | $177,500 | |
| Closed | Nieman Mark C | $182,541 |
Source: Public Records
Tax History
| Year | Tax Paid | Tax Assessment Tax Assessment Total Assessment is a certain percentage of the fair market value that is determined by local assessors to be the total taxable value of land and additions on the property. | Land | Improvement |
|---|---|---|---|---|
| 2025 | $4,759 | $106,560 | $28,000 | $78,560 |
| 2024 | $4,759 | $106,560 | $28,000 | $78,560 |
| 2023 | $4,047 | $80,832 | $14,042 | $66,790 |
| 2022 | $4,000 | $80,833 | $14,042 | $66,791 |
| 2021 | $3,814 | $80,833 | $14,042 | $66,791 |
| 2020 | $3,787 | $68,502 | $11,900 | $56,602 |
| 2019 | $3,850 | $68,502 | $11,900 | $56,602 |
| 2018 | $3,732 | $68,502 | $11,900 | $56,602 |
| 2017 | $3,329 | $60,697 | $10,721 | $49,977 |
| 2016 | $3,408 | $60,697 | $10,721 | $49,977 |
| 2015 | $3,405 | $60,697 | $10,721 | $49,977 |
| 2014 | $3,496 | $55,690 | $9,840 | $45,850 |
| 2013 | $3,537 | $67,380 | $11,900 | $55,480 |
Source: Public Records
Map
Nearby Homes
- 5705 Pepperridge Ct
- 5900 Driftwood Ct
- 616 Crabapple Ct
- 161 Arbor Glen Ct
- 98 Bedles Ct
- 5598 Noble Ct
- 0 Deere Run Ln Unit 1836428
- 5530 Windsor Ct
- 120 Ridgeview Ln
- 122 Deere Run Ln
- 668 Thornton Dr
- 5548 Castle Dr
- 219 Chateau Valley Ln
- 723 Grande Oaks Dr
- 329 Stone Ridge Blvd
- 5223 Grants Settlement
- 5234 Highmeadow Place
- 5079 Ross Ridge Rd
- 767 Elm Tree Dr
- 5096 Riverview Dr
- 5679 Wyntree Ct
- 5687 Wyntree Ct
- 5738 Pepperridge Ct
- 5732 Pepperridge Ct
- 5675 Wyntree Ct
- 5726 Pepperridge Ct
- 5744 Pepperridge Ct
- 5680 Wyntree Ct
- 5720 Pepperridge Ct
- 5671 Wyntree Ct
- 5691 Wyntree Ct
- 5684 Wyntree Ct
- 389 Old Willow Ct
- 385 Old Willow Ct
- 5714 Pepperridge Ct
- 5772 Pepperridge Ct
- 5735 Pepperridge Ct
- 5692 Wyntree Ct
- 5729 Pepperridge Ct
- 5667 Wyntree Ct
Your Personal Tour Guide
Ask me questions while you tour the home.