5687 E St Springfield, OR 97478
Thurston NeighborhoodEstimated Value: $380,417 - $390,000
3
Beds
2
Baths
1,216
Sq Ft
$317/Sq Ft
Est. Value
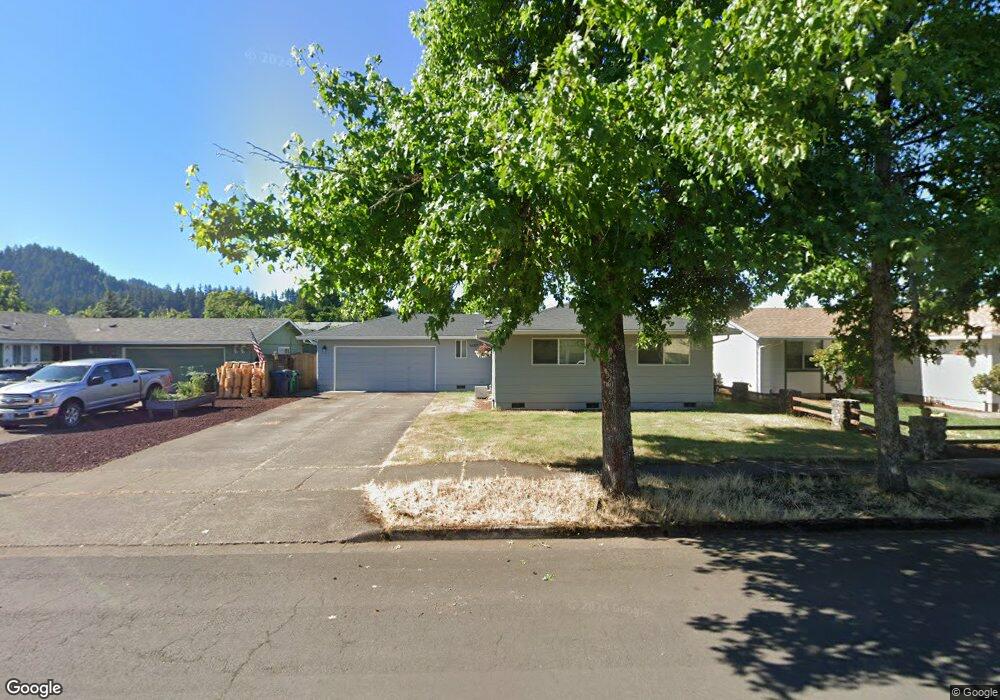
About This Home
This home is located at 5687 E St, Springfield, OR 97478 and is currently estimated at $385,604, approximately $317 per square foot. 5687 E St is a home located in Lane County with nearby schools including Ridgeview Elementary School, Thurston Middle School, and Thurston High School.
Ownership History
Date
Name
Owned For
Owner Type
Purchase Details
Closed on
May 26, 2022
Sold by
Zaworski William J
Bought by
Tarango Eric Matthew and Tarango Andrea Martinez
Current Estimated Value
Home Financials for this Owner
Home Financials are based on the most recent Mortgage that was taken out on this home.
Original Mortgage
$362,193
Outstanding Balance
$343,103
Interest Rate
5.1%
Mortgage Type
VA
Estimated Equity
$42,501
Purchase Details
Closed on
Jun 3, 2011
Sold by
Mamula Ankica
Bought by
Zaworski William J
Home Financials for this Owner
Home Financials are based on the most recent Mortgage that was taken out on this home.
Original Mortgage
$121,919
Interest Rate
4.5%
Mortgage Type
FHA
Purchase Details
Closed on
Oct 19, 1999
Sold by
Mamula Charles
Bought by
Mamula Charles and Mamula Ankica
Create a Home Valuation Report for This Property
The Home Valuation Report is an in-depth analysis detailing your home's value as well as a comparison with similar homes in the area
Home Values in the Area
Average Home Value in this Area
Purchase History
| Date | Buyer | Sale Price | Title Company |
|---|---|---|---|
| Tarango Eric Matthew | $365,000 | Cascade Title | |
| Zaworski William J | $134,125 | Fidelity National Title Insu | |
| Mamula Charles | -- | -- |
Source: Public Records
Mortgage History
| Date | Status | Borrower | Loan Amount |
|---|---|---|---|
| Open | Tarango Eric Matthew | $362,193 | |
| Previous Owner | Zaworski William J | $121,919 |
Source: Public Records
Tax History
| Year | Tax Paid | Tax Assessment Tax Assessment Total Assessment is a certain percentage of the fair market value that is determined by local assessors to be the total taxable value of land and additions on the property. | Land | Improvement |
|---|---|---|---|---|
| 2025 | $2,937 | $160,156 | -- | -- |
| 2024 | $2,889 | $155,492 | -- | -- |
| 2023 | $2,889 | $150,964 | $0 | $0 |
| 2022 | $2,676 | $146,567 | $0 | $0 |
| 2021 | $2,628 | $142,299 | $0 | $0 |
| 2020 | $2,551 | $138,155 | $0 | $0 |
| 2019 | $2,475 | $134,132 | $0 | $0 |
| 2018 | $2,333 | $126,433 | $0 | $0 |
| 2017 | $2,243 | $126,433 | $0 | $0 |
| 2016 | $2,196 | $122,750 | $0 | $0 |
| 2015 | $2,133 | $119,175 | $0 | $0 |
| 2014 | $2,101 | $115,704 | $0 | $0 |
Source: Public Records
Map
Nearby Homes
- 676 58th St
- 5524 E St
- 5736 A St
- 5570 B St
- 733 54th St
- 775 54th St
- 340 54th St
- 5495 A Units 69 70 71 72 St
- 5995 Main St
- 205 S 54th St
- 205 S 54th (#11) St Unit 11
- 421 S 58th St
- 5335 Main St Unit 236
- 5335 Main St
- 5335 Main St Unit 184
- 5335 Main St Unit 197
- 5335 Main St Unit 7
- 5335 Main St Unit 154
- 5335 Main St Unit 187
- 6445 B St
Your Personal Tour Guide
Ask me questions while you tour the home.