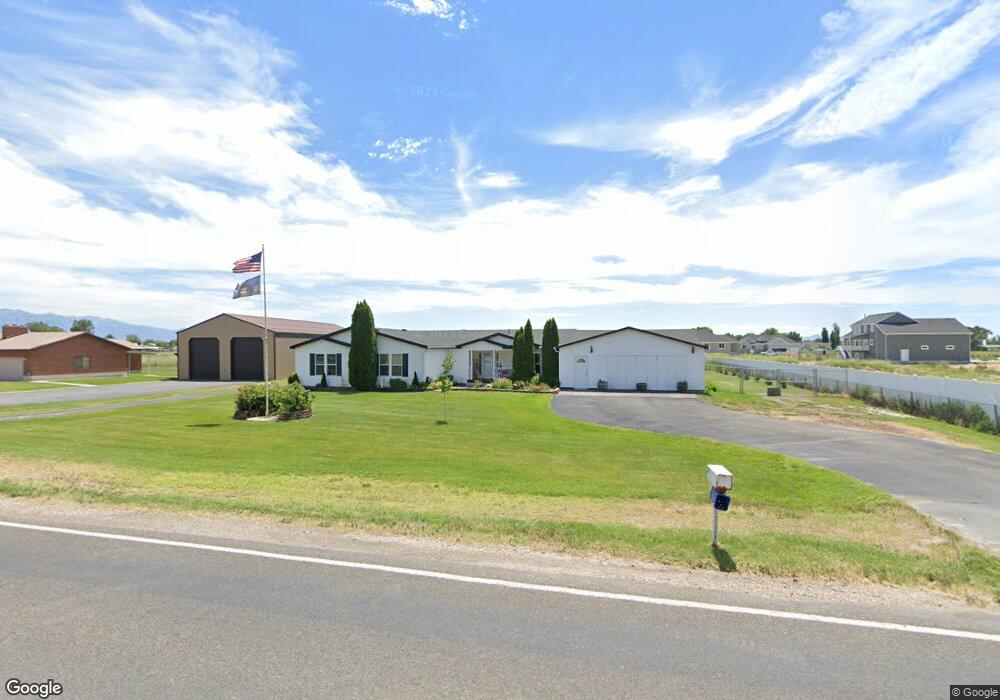
5689 W 4000 S Hooper, UT 84315
Estimated Value: $691,000 - $880,558
3
Beds
2
Baths
3,219
Sq Ft
$245/Sq Ft
Est. Value
About This Home
This home is located at 5689 W 4000 S, Hooper, UT 84315 and is currently estimated at $788,640, approximately $244 per square foot. 5689 W 4000 S is a home located in Weber County with nearby schools including Hooper Elementary School, Rocky Mountain Junior High School, and Fremont High School.
Ownership History
Date
Name
Owned For
Owner Type
Purchase Details
Closed on
Dec 28, 2020
Sold by
Sackett Scott Lavell and Sackett Jana Lee
Bought by
Sackett Scott Lavell and Sackett Jan
Current Estimated Value
Home Financials for this Owner
Home Financials are based on the most recent Mortgage that was taken out on this home.
Original Mortgage
$229,500
Outstanding Balance
$166,025
Interest Rate
2.2%
Mortgage Type
New Conventional
Estimated Equity
$622,615
Purchase Details
Closed on
Mar 25, 2020
Sold by
Bench Thomas Leavitt and Bench Nancy
Bought by
Sackett Scott Lavell and Sackett Jana Lee
Home Financials for this Owner
Home Financials are based on the most recent Mortgage that was taken out on this home.
Original Mortgage
$385,700
Outstanding Balance
$263,290
Interest Rate
2.9%
Mortgage Type
New Conventional
Estimated Equity
$525,350
Purchase Details
Closed on
Jan 23, 2020
Sold by
Bench Thomas Leavitt and Bench Nancy
Bought by
Bench Thomas Leavitt and Bench Nancy
Purchase Details
Closed on
Feb 15, 2017
Sold by
Bench Thomas Leavitt and Bench Nancy
Bought by
Bench Thomas Leavitt and Bench Nancy
Purchase Details
Closed on
Nov 20, 2003
Sold by
Beus Marjorie B
Bought by
Bench Thomas Leavitt and Bench Nancy
Create a Home Valuation Report for This Property
The Home Valuation Report is an in-depth analysis detailing your home's value as well as a comparison with similar homes in the area
Home Values in the Area
Average Home Value in this Area
Purchase History
| Date | Buyer | Sale Price | Title Company |
|---|---|---|---|
| Sackett Scott Lavell | -- | First American Title Ins Co | |
| Sackett Scott Lavell | -- | Backman Ntp | |
| Bench Thomas Leavitt | -- | Backman Title Services Ltd | |
| Bench Thomas Leavitt | -- | None Available | |
| Bench Thomas Leavitt | -- | Founders Title |
Source: Public Records
Mortgage History
| Date | Status | Borrower | Loan Amount |
|---|---|---|---|
| Open | Sackett Scott Lavell | $229,500 | |
| Open | Sackett Scott Lavell | $385,700 |
Source: Public Records
Tax History Compared to Growth
Tax History
| Year | Tax Paid | Tax Assessment Tax Assessment Total Assessment is a certain percentage of the fair market value that is determined by local assessors to be the total taxable value of land and additions on the property. | Land | Improvement |
|---|---|---|---|---|
| 2025 | $4,430 | $770,260 | $219,140 | $551,120 |
| 2024 | $4,258 | $415,847 | $120,412 | $295,435 |
| 2023 | $3,447 | $333,637 | $120,412 | $213,225 |
| 2022 | $3,569 | $351,450 | $106,553 | $244,897 |
| 2021 | $3,018 | $500,000 | $103,850 | $396,150 |
| 2020 | $2,821 | $428,000 | $89,037 | $338,963 |
| 2019 | $2,914 | $418,001 | $64,367 | $353,634 |
| 2018 | $2,789 | $383,000 | $64,367 | $318,633 |
| 2017 | $2,923 | $367,001 | $64,605 | $302,396 |
| 2016 | $2,102 | $151,898 | $27,284 | $124,614 |
| 2015 | $2,012 | $143,313 | $24,633 | $118,680 |
| 2014 | $1,858 | $128,738 | $24,633 | $104,105 |
Source: Public Records
Map
Nearby Homes
- 4146 S 5800 W Unit 5
- 4163 S 5800 W Unit 2
- 3706 S 5650 W Unit 9
- 3691 S 5600 W Unit 20
- 4111 S 5350 W
- 5478 W 3750 S
- 5389 W 3850 S Unit 22
- 5417 W 3850 S
- 3570 S 5425 W
- 3729 S 5600 W Unit 6
- 3720 S 5600 W Unit 2
- 3719 S 5600 W Unit 7
- 5947 W 4600 S
- 3191 S 5100 St W Unit 1
- 3223 S 4975 W Unit 15
- 3257 S 4975 W Unit 12
- 3269 S 4975 W Unit 11
- 3233 S 4975 W Unit 14
- 3731 S 4975 W
- 3243 S 4950 W Unit 25
- 5663 W 4000 S
- 5686 W 4000 S
- 4078 S 5725 W
- 5666 W 4000 S
- 4098 S 5725 W Unit 104
- 5640 W 4000 S
- 5646 W 4000 S
- 5718 W 4000 S
- 5677 W 3900 S
- 5626 W 4000 S
- 5741 W 4100 S Unit 109
- 5667 W 3900 S
- 3965 S 5600 W Unit 18
- 5766 W 4100 S
- 3915 S 5675 W
- 5657 W 3900 S
- 5577 W 4000 S
- 3895 S 5675 W
- 3895 S 5675 W Unit 25
- 5603 W 3900 S