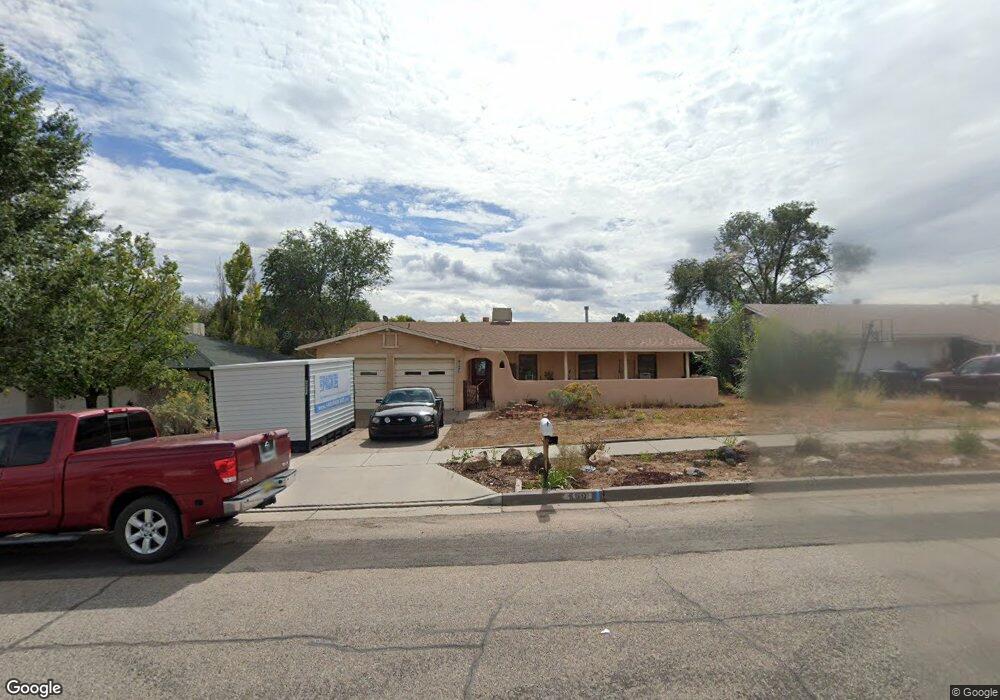
569 Aragon Ave Los Alamos, NM 87547
Estimated Value: $457,000 - $498,000
4
Beds
2
Baths
1,437
Sq Ft
$337/Sq Ft
Est. Value
About This Home
This home is located at 569 Aragon Ave, Los Alamos, NM 87547 and is currently estimated at $483,650, approximately $336 per square foot. 569 Aragon Ave is a home located in Los Alamos County with nearby schools including Chamisa Elementary School, Los Alamos Middle School, and Los Alamos High School.
Ownership History
Date
Name
Owned For
Owner Type
Purchase Details
Closed on
Jul 24, 2025
Sold by
Przybyski Cover and Przybyski Anne
Bought by
Wiedel Jason and Wiedel Tessa
Current Estimated Value
Home Financials for this Owner
Home Financials are based on the most recent Mortgage that was taken out on this home.
Original Mortgage
$374,056
Outstanding Balance
$373,421
Interest Rate
6.84%
Mortgage Type
New Conventional
Estimated Equity
$110,229
Purchase Details
Closed on
Oct 21, 2011
Sold by
Los Alamos National Bank
Bought by
Cover Matthew
Home Financials for this Owner
Home Financials are based on the most recent Mortgage that was taken out on this home.
Original Mortgage
$207,253
Interest Rate
4.14%
Mortgage Type
New Conventional
Purchase Details
Closed on
Apr 19, 2005
Sold by
Downing Scott Richardson and Downing Donna Christine
Bought by
Shadle Zachary W and Shadle Cheryl Y
Home Financials for this Owner
Home Financials are based on the most recent Mortgage that was taken out on this home.
Original Mortgage
$55,000
Interest Rate
6.06%
Mortgage Type
Future Advance Clause Open End Mortgage
Create a Home Valuation Report for This Property
The Home Valuation Report is an in-depth analysis detailing your home's value as well as a comparison with similar homes in the area
Home Values in the Area
Average Home Value in this Area
Purchase History
| Date | Buyer | Sale Price | Title Company |
|---|---|---|---|
| Wiedel Jason | -- | None Listed On Document | |
| Cover Matthew | -- | -- | |
| Shadle Zachary W | -- | -- |
Source: Public Records
Mortgage History
| Date | Status | Borrower | Loan Amount |
|---|---|---|---|
| Open | Wiedel Jason | $374,056 | |
| Previous Owner | Cover Matthew | $207,253 | |
| Previous Owner | Shadle Zachary W | $55,000 | |
| Previous Owner | Shadle Zachary W | $194,400 |
Source: Public Records
Tax History Compared to Growth
Tax History
| Year | Tax Paid | Tax Assessment Tax Assessment Total Assessment is a certain percentage of the fair market value that is determined by local assessors to be the total taxable value of land and additions on the property. | Land | Improvement |
|---|---|---|---|---|
| 2025 | $1,838 | $77,420 | $24,830 | $52,590 |
| 2024 | $1,771 | $75,170 | $24,460 | $50,710 |
| 2023 | $1,752 | $72,990 | $24,090 | $48,900 |
| 2022 | $1,712 | $70,860 | $23,630 | $47,230 |
| 2021 | $1,657 | $68,800 | $23,230 | $45,570 |
| 2020 | $1,639 | $66,790 | $22,870 | $43,920 |
| 2019 | $1,616 | $64,850 | $22,350 | $42,500 |
| 2018 | $1,579 | $62,960 | $21,890 | $41,070 |
| 2017 | $1,543 | $61,130 | $21,500 | $39,630 |
| 2016 | $1,447 | $59,350 | $21,500 | $37,850 |
| 2015 | $1,421 | $58,170 | $21,060 | $37,110 |
| 2014 | $1,298 | $57,460 | $21,060 | $36,400 |
| 2013 | $1,366 | $60,980 | $22,890 | $38,090 |
| 2011 | $1,365 | $63,360 | $22,850 | $40,510 |
Source: Public Records
Map
Nearby Homes
- 459 Pruitt Ave
- 85 Granada Dr
- 85 Chiquita Dr
- 310 Grand Canyon Dr
- 86 Altura Dr
- 525 Aster
- 67 Delicado Dr
- 855 Aster
- 319 Ridgecrest Ave
- 220 Grand Canyon Dr
- 333 Kimberly Ln
- 704 Meadow Ln
- 75 Park Ln Unit A
- 206 Rover Blvd
- 208 Rover Blvd
- 534 Paul Place
- 723 Jeffrey Place
- 128 Beryl St
- 105 Agate St
- 111 Aragon Ave