Estimated Value: $261,000 - $403,000
2
Beds
1
Bath
1,440
Sq Ft
$223/Sq Ft
Est. Value
About This Home
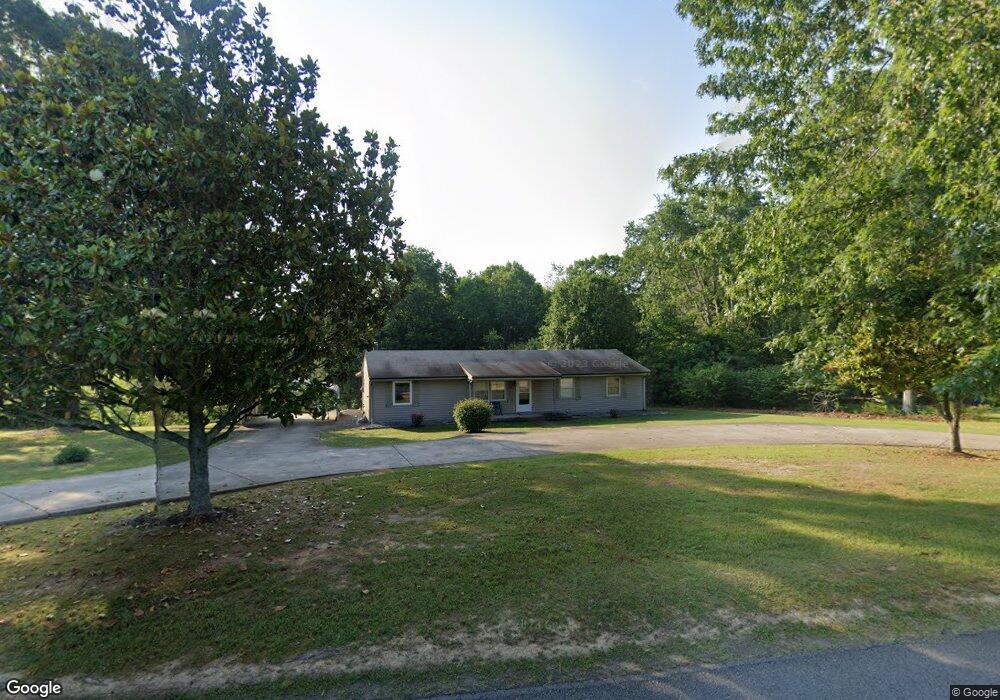
This home is located at 569 Bob Hollow Rd, Burns, TN 37029 and is currently estimated at $320,697, approximately $222 per square foot. 569 Bob Hollow Rd is a home located in Dickson County with nearby schools including Stuart Burns Elementary School, Burns Middle School, and Dickson County High School.
Ownership History
Date
Name
Owned For
Owner Type
Purchase Details
Closed on
Feb 28, 2024
Sold by
Mosley E Wayne
Bought by
Stocko Leslie
Current Estimated Value
Purchase Details
Closed on
May 8, 2018
Sold by
Mosley Carlene B
Bought by
Mosley Carlene B
Purchase Details
Closed on
Oct 29, 1976
Bought by
Herning William D and Herning Carlene B
Purchase Details
Closed on
Nov 26, 1975
Create a Home Valuation Report for This Property
The Home Valuation Report is an in-depth analysis detailing your home's value as well as a comparison with similar homes in the area
Home Values in the Area
Average Home Value in this Area
Purchase History
| Date | Buyer | Sale Price | Title Company |
|---|---|---|---|
| Stocko Leslie | $275,000 | Bankers Title | |
| Mosley E Wayne | -- | None Listed On Document | |
| Mosley E Wayne | -- | None Listed On Document | |
| Mosley Carlene B | -- | -- | |
| Herning William D | -- | -- | |
| -- | -- | -- |
Source: Public Records
Tax History Compared to Growth
Tax History
| Year | Tax Paid | Tax Assessment Tax Assessment Total Assessment is a certain percentage of the fair market value that is determined by local assessors to be the total taxable value of land and additions on the property. | Land | Improvement |
|---|---|---|---|---|
| 2024 | $1,137 | $67,275 | $32,375 | $34,900 |
| 2023 | $890 | $37,875 | $10,875 | $27,000 |
| 2022 | $890 | $37,875 | $10,875 | $27,000 |
| 2021 | $890 | $37,875 | $10,875 | $27,000 |
| 2020 | $890 | $37,875 | $10,875 | $27,000 |
| 2019 | $890 | $37,875 | $10,875 | $27,000 |
| 2018 | $721 | $26,700 | $9,500 | $17,200 |
| 2017 | $721 | $26,700 | $9,500 | $17,200 |
| 2016 | $721 | $26,700 | $9,500 | $17,200 |
| 2015 | $708 | $24,425 | $9,500 | $14,925 |
| 2014 | $708 | $24,425 | $9,500 | $14,925 |
Source: Public Records
Map
Nearby Homes
- 570 Bob Hollow Rd
- 1698 Porter Rd
- 1688 Porter Rd
- 500 Brown Rd
- 500 Tidwell Rd
- 10515 Twin Springs Ln
- 1237 Abiff Rd
- 399 Edgar Meeks Rd
- 2157 Abiff Rd
- 1236 S Tidwell Rd
- 20005 Easy St
- 921 Eli Rd
- 0 Abiff Rd
- 0 Moss Branch Rd
- 0 Eli Rd
- 0 Iron Hill Rd W
- 0 Cherry Blossom Way
- 102 Cherry Blossom Way
- 104 Cherry Blossom Way
- 113 Cherry Blossom Way
- 573 Bob Hollow Rd
- 590 Bob Hollow Rd
- 583 Bob Hollow Rd
- 591 Bob Hollow Rd
- 593 Bob Hollow Rd
- 605 Bob Hollow Rd
- 600 Bob Hollow Rd
- 665 Bob Hollow Rd
- 112 Needham Ln
- 110 Needham Ln
- 176 Jordan Cemetery Rd
- 111 Needham Ln
- 108 Needham Ln
- 182 Jordan Cemetery Rd
- 109 Needham Ln
- 182 Jordan Cemetery Rd
- 502 Bob Hollow Rd
- 186 Jordan Cemetery Rd
- 107 Needham Ln
- 1706 Abiff Rd