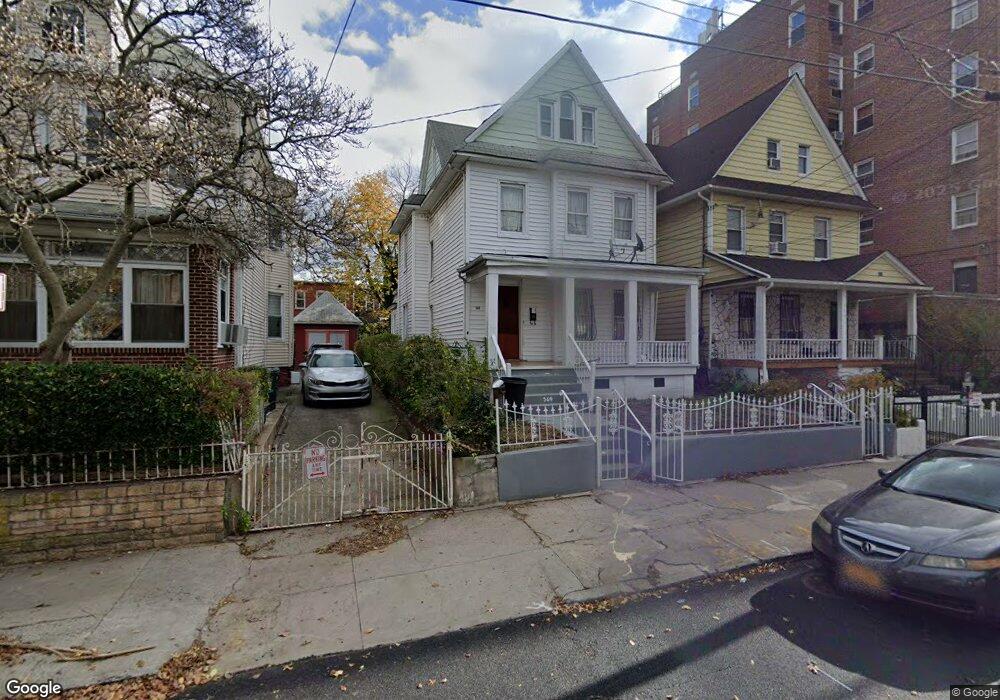
569 E 32nd St Brooklyn, NY 11210
Flatbush NeighborhoodEstimated Value: $785,367 - $1,269,000
Studio
--
Bath
1,782
Sq Ft
$538/Sq Ft
Est. Value
About This Home
This home is located at 569 E 32nd St, Brooklyn, NY 11210 and is currently estimated at $958,342, approximately $537 per square foot. 569 E 32nd St is a home located in Kings County with nearby schools including J.H.S. 278 Marine Park, Jhs 234 Arthur W Cunningham, and Jhs 14 Shell Bank.
Ownership History
Date
Name
Owned For
Owner Type
Purchase Details
Closed on
Jan 23, 2008
Sold by
Fraser Vasisty
Bought by
Fraser Vasisty and Lewis Ian O
Current Estimated Value
Purchase Details
Closed on
Sep 6, 2002
Sold by
Ambersley Omar and Ambersley Tuesday
Bought by
Fraser Vasisty
Home Financials for this Owner
Home Financials are based on the most recent Mortgage that was taken out on this home.
Original Mortgage
$226,600
Outstanding Balance
$92,851
Interest Rate
6.24%
Mortgage Type
Purchase Money Mortgage
Estimated Equity
$865,491
Purchase Details
Closed on
May 29, 1998
Sold by
Mr Foreclosure Inc
Bought by
Ambersley Omar and Ambersley Tuesday
Home Financials for this Owner
Home Financials are based on the most recent Mortgage that was taken out on this home.
Original Mortgage
$188,037
Interest Rate
7.02%
Purchase Details
Closed on
Mar 10, 1998
Sold by
Markiewicz Wayne and Markiewicz Gregory
Bought by
Mr Foreclosure Inc
Create a Home Valuation Report for This Property
The Home Valuation Report is an in-depth analysis detailing your home's value as well as a comparison with similar homes in the area
Home Values in the Area
Average Home Value in this Area
Purchase History
| Date | Buyer | Sale Price | Title Company |
|---|---|---|---|
| Fraser Vasisty | -- | -- | |
| Fraser Vasisty | -- | -- | |
| Fraser Vasisty | -- | -- | |
| Fraser Vasisty | -- | -- | |
| Ambersley Omar | $190,000 | Fidelity National Title Ins | |
| Ambersley Omar | $190,000 | Fidelity National Title Ins | |
| Mr Foreclosure Inc | $116,000 | Commonwealth Land Title Ins | |
| Mr Foreclosure Inc | $116,000 | Commonwealth Land Title Ins |
Source: Public Records
Mortgage History
| Date | Status | Borrower | Loan Amount |
|---|---|---|---|
| Open | Fraser Vasisty | $226,600 | |
| Closed | Fraser Vasisty | $226,600 | |
| Previous Owner | Ambersley Omar | $188,037 | |
| Closed | Fraser Vasisty | $0 |
Source: Public Records
Tax History
| Year | Tax Paid | Tax Assessment Tax Assessment Total Assessment is a certain percentage of the fair market value that is determined by local assessors to be the total taxable value of land and additions on the property. | Land | Improvement |
|---|---|---|---|---|
| 2025 | $6,332 | $50,880 | $17,880 | $33,000 |
| 2024 | $6,332 | $45,360 | $17,880 | $27,480 |
| 2023 | $6,040 | $55,680 | $17,880 | $37,800 |
| 2022 | $5,602 | $52,500 | $17,880 | $34,620 |
| 2021 | $5,571 | $51,780 | $17,880 | $33,900 |
| 2020 | $2,770 | $50,520 | $17,880 | $32,640 |
| 2019 | $5,495 | $50,520 | $17,880 | $32,640 |
| 2018 | $5,052 | $24,784 | $11,504 | $13,280 |
| 2017 | $4,767 | $23,383 | $11,367 | $12,016 |
| 2016 | $4,410 | $22,062 | $10,921 | $11,141 |
| 2015 | $2,441 | $22,062 | $10,151 | $11,911 |
| 2014 | $2,441 | $21,892 | $10,687 | $11,205 |
Source: Public Records
Map
Nearby Homes
- 563 E 32nd St
- 1462 New York Ave
- 627 E 32nd St
- 785 E 34th St Unit 3-C
- 720 E 35th St
- 579 E 29th St
- 720 Brooklyn Ave Unit 5K
- 2913 Foster Ave Unit 1B
- 2913 Foster Ave Unit 2F
- 2913 Foster Ave Unit 6G
- 559 E 28th St
- 1513 Brooklyn Ave
- 788 E 37th St
- 1558 Brooklyn Ave
- 1322 New York Ave
- 720 E 32nd St Unit 5G
- 448 E 29th St
- 720 E 31st St Unit 5K
- 720 E 31st St Unit 4K
- 455 E 28th St
- 573 E 32nd St
- 561 E 32nd St
- 1468 New York Ave
- 1470 New York Ave
- 559 E 32nd St
- 1466 New York Ave
- 1472 New York Ave
- 1464 New York Ave
- 1474 New York Ave
- 555 E 32nd St
- 1478 New York Ave
- 1460 New York Ave
- 1460 New York Ave Unit 1
- 1460 New York Ave Unit 2
- 572 E 32 St
- 564 E 32 St
- 553 E 32nd St
- 1456 New York Ave
- 1452 New York Ave
- 572 E 32nd St
Your Personal Tour Guide
Ask me questions while you tour the home.