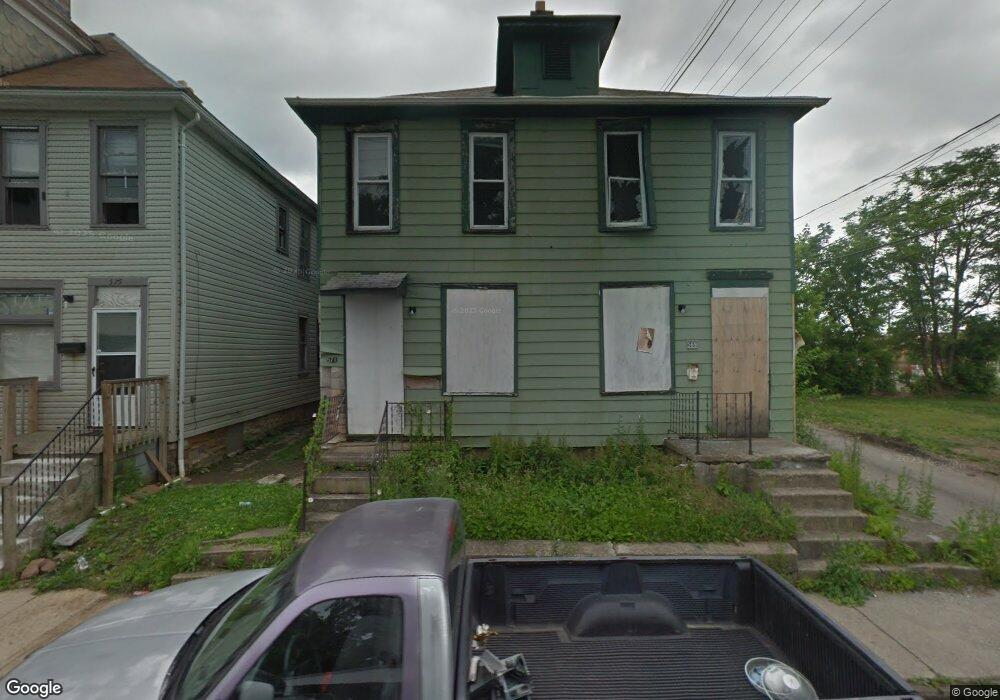
569 E Columbus St Unit 571 Columbus, OH 43206
Southern Orchards NeighborhoodEstimated Value: $228,947
4
Beds
2
Baths
2,252
Sq Ft
$102/Sq Ft
Est. Value
About This Home
This home is located at 569 E Columbus St Unit 571, Columbus, OH 43206 and is currently estimated at $228,947, approximately $101 per square foot. 569 E Columbus St Unit 571 is a home located in Franklin County with nearby schools including Livingston Elementary School, South High School, and South Columbus Preparatory Academy.
Ownership History
Date
Name
Owned For
Owner Type
Purchase Details
Closed on
Jun 20, 2019
Sold by
Central Ohio Community Improvement Corp
Bought by
City Of Columbus
Current Estimated Value
Purchase Details
Closed on
Sep 25, 2018
Sold by
Mingo Clarence E
Bought by
Central Ohio Community Improvement Corp
Purchase Details
Closed on
Jun 19, 2000
Sold by
Resatka Richard R
Bought by
Resatka Richard R and Richard R Resatka Trust
Purchase Details
Closed on
Aug 6, 1999
Sold by
Kenreich Brent G
Bought by
Resatka Richard R
Purchase Details
Closed on
Aug 28, 1997
Sold by
Speakman Pamela A
Bought by
Kemreich Brent G
Home Financials for this Owner
Home Financials are based on the most recent Mortgage that was taken out on this home.
Original Mortgage
$65,320
Interest Rate
7.57%
Purchase Details
Closed on
Mar 18, 1991
Create a Home Valuation Report for This Property
The Home Valuation Report is an in-depth analysis detailing your home's value as well as a comparison with similar homes in the area
Home Values in the Area
Average Home Value in this Area
Purchase History
| Date | Buyer | Sale Price | Title Company |
|---|---|---|---|
| City Of Columbus | -- | None Available | |
| Central Ohio Community Improvement Corp | -- | None Available | |
| Resatka Richard R | -- | -- | |
| Resatka Richard R | $81,300 | Connor Title Co | |
| Kemreich Brent G | $81,700 | Stewart Title Agency Of Colu | |
| -- | $17,500 | -- |
Source: Public Records
Mortgage History
| Date | Status | Borrower | Loan Amount |
|---|---|---|---|
| Previous Owner | Kemreich Brent G | $65,320 | |
| Closed | Kemreich Brent G | $16,330 |
Source: Public Records
Tax History
| Year | Tax Paid | Tax Assessment Tax Assessment Total Assessment is a certain percentage of the fair market value that is determined by local assessors to be the total taxable value of land and additions on the property. | Land | Improvement |
|---|---|---|---|---|
| 2025 | -- | $1,300 | $1,300 | -- |
| 2024 | -- | $1,300 | $1,300 | -- |
| 2023 | -- | $1,295 | $1,295 | $0 |
| 2022 | $0 | $1,300 | $1,300 | $0 |
| 2021 | $0 | $1,300 | $1,300 | $0 |
Source: Public Records
Map
Nearby Homes
- 615 E Columbus St
- 841 Ann St
- 497 E Kossuth St
- 517 Forest St
- 630 Stanley Ave
- 751 Wager St
- 827 S 17th St
- 472 E Whittier St
- 432 E Kossuth St
- 640 E Whittier St
- 438 E Columbus St
- 676 Wager St
- 487 E Beck St
- 530 Stewart Ave
- 550 Stewart Ave
- 863 Carpenter St
- 741 Heyl Ave
- 466 South Ln
- 779-781 Stanley Ave
- 735 Reinhard Ave
- 575 E Columbus St Unit 577
- 575-577 E Columbus St
- 575 E Columbus St Unit 7
- 579 E Columbus St
- 563 E Columbus St
- 867 Wager St
- 860 Parsons Ave
- 572 E Columbus St
- 578 E Columbus St
- 831 Wager St Unit 833
- 830 Parsons Ave
- 595 E Columbus St
- 876 Wager St
- 870 Wager St
- 825 Wager St Unit 27
- 599 E Columbus St
- 827 Wager St
- 603 E Columbus St
- 819 Wager St
- 840 Wager St Unit 842
Your Personal Tour Guide
Ask me questions while you tour the home.