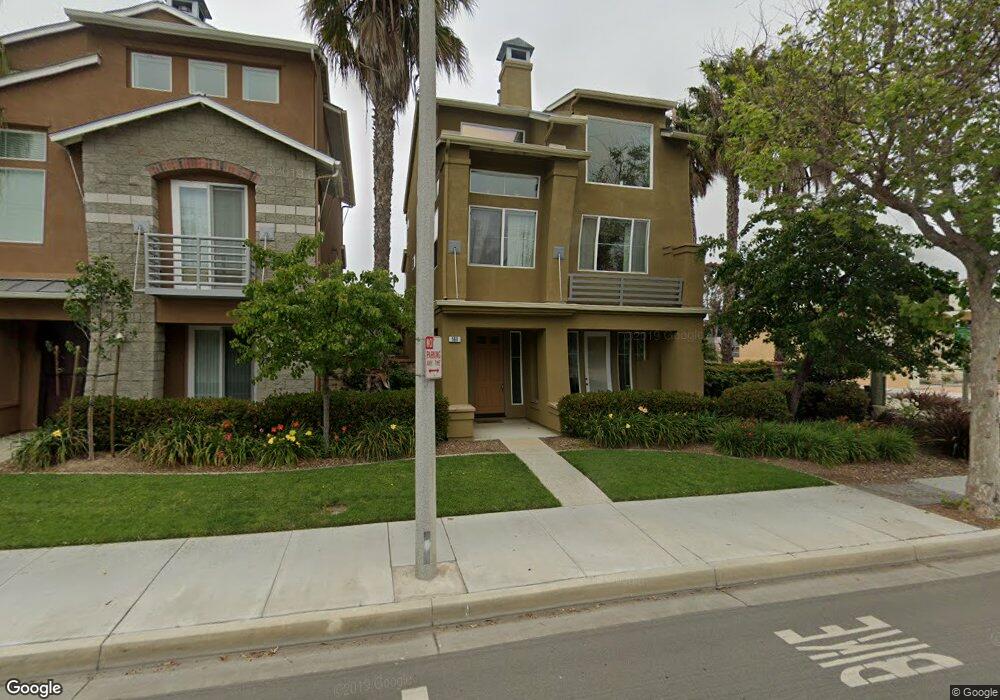
569 E Port Hueneme Rd Port Hueneme, CA 93041
Estimated Value: $782,000 - $860,462
3
Beds
3
Baths
1,894
Sq Ft
$432/Sq Ft
Est. Value
About This Home
This home is located at 569 E Port Hueneme Rd, Port Hueneme, CA 93041 and is currently estimated at $819,116, approximately $432 per square foot. 569 E Port Hueneme Rd is a home located in Ventura County with nearby schools including Hueneme Elementary and Hueneme High School.
Ownership History
Date
Name
Owned For
Owner Type
Purchase Details
Closed on
Sep 1, 2011
Sold by
Keene Robin Elaine
Bought by
Correia Manuel G
Current Estimated Value
Home Financials for this Owner
Home Financials are based on the most recent Mortgage that was taken out on this home.
Original Mortgage
$228,000
Outstanding Balance
$156,133
Interest Rate
4.26%
Mortgage Type
New Conventional
Estimated Equity
$662,983
Purchase Details
Closed on
Jun 22, 2011
Sold by
Keene Marcus B
Bought by
Keene Robin Elaine
Purchase Details
Closed on
Jul 11, 2006
Sold by
Shell Cove Llc
Bought by
Keene Marcus Boyd and Keene Robin Elaine
Home Financials for this Owner
Home Financials are based on the most recent Mortgage that was taken out on this home.
Original Mortgage
$20,000
Interest Rate
6.19%
Mortgage Type
Credit Line Revolving
Create a Home Valuation Report for This Property
The Home Valuation Report is an in-depth analysis detailing your home's value as well as a comparison with similar homes in the area
Home Values in the Area
Average Home Value in this Area
Purchase History
| Date | Buyer | Sale Price | Title Company |
|---|---|---|---|
| Correia Manuel G | $298,000 | First American Title Company | |
| Keene Robin Elaine | -- | None Available | |
| Keene Marcus Boyd | $683,000 | First American Title Company |
Source: Public Records
Mortgage History
| Date | Status | Borrower | Loan Amount |
|---|---|---|---|
| Open | Correia Manuel G | $228,000 | |
| Previous Owner | Keene Marcus Boyd | $20,000 | |
| Previous Owner | Keene Marcus Boyd | $546,400 |
Source: Public Records
Tax History Compared to Growth
Tax History
| Year | Tax Paid | Tax Assessment Tax Assessment Total Assessment is a certain percentage of the fair market value that is determined by local assessors to be the total taxable value of land and additions on the property. | Land | Improvement |
|---|---|---|---|---|
| 2025 | $4,421 | $374,291 | $187,147 | $187,144 |
| 2024 | $4,421 | $366,952 | $183,477 | $183,475 |
| 2023 | $4,204 | $359,757 | $179,879 | $179,878 |
| 2022 | $4,086 | $352,703 | $176,352 | $176,351 |
| 2021 | $4,083 | $345,788 | $172,894 | $172,894 |
| 2020 | $4,034 | $342,244 | $171,122 | $171,122 |
| 2019 | $3,978 | $335,534 | $167,767 | $167,767 |
| 2018 | $3,847 | $328,956 | $164,478 | $164,478 |
| 2017 | $3,708 | $322,506 | $161,253 | $161,253 |
| 2016 | $3,598 | $316,184 | $158,092 | $158,092 |
| 2015 | $3,509 | $311,436 | $155,718 | $155,718 |
| 2014 | -- | $305,338 | $152,669 | $152,669 |
Source: Public Records
Map
Nearby Homes
- 420 Village Rd
- 664 Beachport Dr
- 632 Joyce Dr
- 303 Blue Dolphin Dr
- 201 S Ventura Rd Unit 15
- 626 Island View Cir
- 618 Island View Cir Unit 618
- 225 S Ventura Rd Unit 102
- 225 S Ventura Rd Unit 79
- 558 Terrace View Place
- 209 S Ventura Rd Unit 31
- 408 Shoreview Dr
- 117 Ann Ave
- 233 N 3rd St
- 750 Island View Cir
- 168 Courtyard Dr
- 755 Ocean Breeze Dr
- 267 S Ventura Rd Unit 274
- 181 Courtyard Dr
- 470 Sanddollar Ln
- 563 E Port Hueneme Rd
- 559 E Port Hueneme Rd
- 553 E Port Hueneme Rd
- 575 Shell Harbor Ln
- 549 E Port Hueneme Rd
- 565 Shell Harbor Ln
- 543 E Port Hueneme Rd
- 555 Shell Harbor Ln
- 615 E Hueneme Rd
- 102 San Nicolas Cir
- 539 E Port Hueneme Rd
- 108 San Nicolas Cir
- 615 E Port Hueneme Rd
- 545 Shell Harbor Ln
- 579 Beachport Dr
- 533 E Port Hueneme Rd
- 585 Beachport Dr
- 101 San Nicolas Cir
- 591 Beachport Dr
- 529 E Port Hueneme Rd