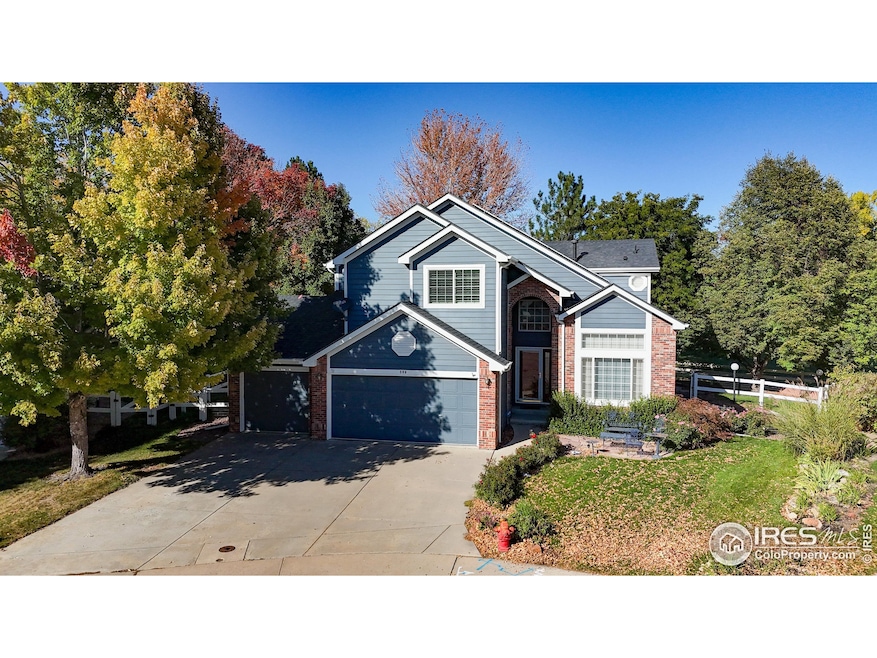
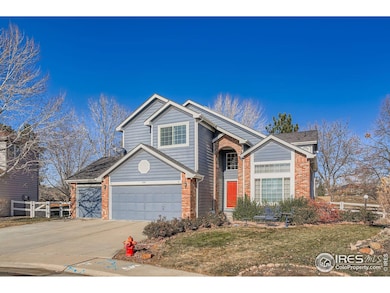
569 Flying Jib Ct Lafayette, CO 80026
Estimated payment $6,791/month
Highlights
- Wooded Lot
- Cathedral Ceiling
- Home Office
- Lafayette Elementary School Rated A
- Wood Flooring
- Hiking Trails
About This Home
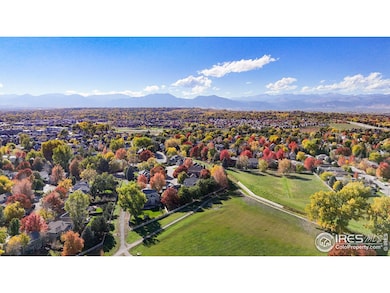
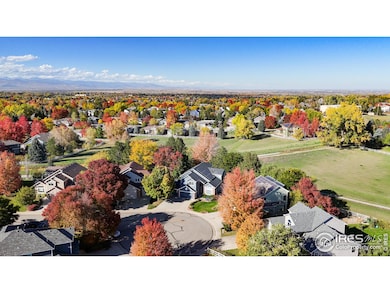
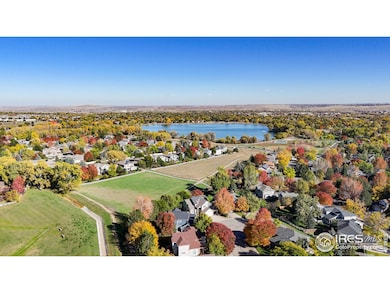
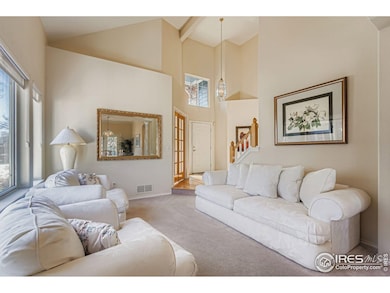
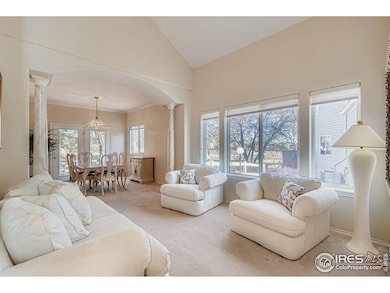
Spacious 2-story at the end of a cul-de-sac on a wonderful private lot backing to large private open space, just a short walk to Waneka Lake Park with its great playground, trails around the lake, boathouse, and glorious continental divide views! Sought after spot near Indian Peaks Golf Course, historic old towns of both Lafayette and Louisville. This home offers great entertaining spaces including large family room open to island kitchen, easy access to back patio. Main level study by front entry has extra sound insulation. Large primary suite on upper level plus three other spacious bedrooms and two full baths. Mostly finished basement features large rec room space and workout room. Fully owned solar PV system on the roof for low utility bills, oversize 3-car garage, built-in surround sound, home security system and nice landscape lighting in the back yard complete the scene. Truly a remarkable opportunity in a premium location!
Open House Schedule
-
Sunday, December 07, 202511:00 am to 1:00 pm12/7/2025 11:00:00 AM +00:0012/7/2025 1:00:00 PM +00:00Add to Calendar
Home Details
Home Type
- Single Family
Est. Annual Taxes
- $5,832
Year Built
- Built in 1995
Lot Details
- 9,396 Sq Ft Lot
- Open Space
- Cul-De-Sac
- Fenced
- Sprinkler System
- Wooded Lot
HOA Fees
- $38 Monthly HOA Fees
Parking
- 3 Car Attached Garage
- Garage Door Opener
Home Design
- Brick Veneer
- Wood Frame Construction
- Composition Roof
Interior Spaces
- 3,901 Sq Ft Home
- 2-Story Property
- Cathedral Ceiling
- Ceiling Fan
- Gas Fireplace
- Window Treatments
- Family Room
- Dining Room
- Home Office
- Recreation Room with Fireplace
- Security System Owned
- Basement
Kitchen
- Eat-In Kitchen
- Electric Oven or Range
- Microwave
- Dishwasher
- Kitchen Island
- Disposal
Flooring
- Wood
- Carpet
- Tile
Bedrooms and Bathrooms
- 5 Bedrooms
- Walk-In Closet
- Primary Bathroom is a Full Bathroom
- Jack-and-Jill Bathroom
- Bathtub and Shower Combination in Primary Bathroom
Laundry
- Laundry on main level
- Dryer
- Washer
Schools
- Lafayette Elementary School
- Angevine Middle School
- Centaurus High School
Utilities
- Forced Air Heating and Cooling System
- Underground Utilities
- High Speed Internet
Additional Features
- Energy-Efficient Thermostat
- Patio
Listing and Financial Details
- Assessor Parcel Number R0117586
Community Details
Overview
- Association fees include common amenities, management
- Waneka Landing Association
- Built by Highland Homes
- Waneka Landing Flg 1 Subdivision
Recreation
- Hiking Trails
Map
Home Values in the Area
Average Home Value in this Area
Tax History
| Year | Tax Paid | Tax Assessment Tax Assessment Total Assessment is a certain percentage of the fair market value that is determined by local assessors to be the total taxable value of land and additions on the property. | Land | Improvement |
|---|---|---|---|---|
| 2025 | $5,832 | $69,475 | $16,475 | $53,000 |
| 2024 | $5,832 | $69,475 | $16,475 | $53,000 |
| 2023 | $5,733 | $72,521 | $18,184 | $58,022 |
| 2022 | $4,677 | $56,740 | $13,587 | $43,153 |
| 2021 | $4,626 | $58,372 | $13,978 | $44,394 |
| 2020 | $4,106 | $52,081 | $12,155 | $39,926 |
| 2019 | $4,050 | $52,081 | $12,155 | $39,926 |
| 2018 | $3,978 | $50,774 | $13,320 | $37,454 |
| 2017 | $3,873 | $56,134 | $14,726 | $41,408 |
| 2016 | $3,559 | $46,725 | $12,338 | $34,387 |
| 2015 | $3,335 | $39,147 | $13,452 | $25,695 |
| 2014 | $2,697 | $39,147 | $13,452 | $25,695 |
Property History
| Date | Event | Price | List to Sale | Price per Sq Ft |
|---|---|---|---|---|
| 12/02/2025 12/02/25 | For Sale | $1,195,000 | -- | $306 / Sq Ft |
Purchase History
| Date | Type | Sale Price | Title Company |
|---|---|---|---|
| Warranty Deed | $271,367 | Land Title |
Mortgage History
| Date | Status | Loan Amount | Loan Type |
|---|---|---|---|
| Previous Owner | $217,000 | No Value Available |
Source: IRES MLS
MLS Number: 1048014
APN: 1575040-19-083
Disclaimer: Certain information contained herein is derived from information provided by parties other than Homes.com. All information provided is deemed reliable, but is not guaranteed to be accurate and should be independently verified.
![]() Information source: Information and Real Estate Services, LLC. Provided for limited non-commercial use only under IRES Rules © Copyright IRES.
Information source: Information and Real Estate Services, LLC. Provided for limited non-commercial use only under IRES Rules © Copyright IRES.
Listing information is provided exclusively for consumers' personal, non-commercial use and may not be used for any purpose other than to identify prospective properties consumers may be interested in purchasing.
Information deemed reliable but not guaranteed by the MLS.
- 597 Portside Ct
- 2319 High Lonesome Trail
- 2313 Glacier Ct
- 2305 Glacier Ct
- 2325 Glacier Ct
- 1362 Golden Eagle Way
- 2251 Evening Star Ln
- 82 Goldhill Dr
- 1376 Snowberry Ln
- 1308 Snowberry Ln Unit 103
- 1308 Snowberry Ln Unit 203
- 1308 Snowberry Ln Unit 301
- 1308 Snowberry Ln Unit 303
- 1312 Snowberry Ln Unit 103
- 2005 Aster Ln
- 1836 Lakespur Ln
- 1304 Snowberry Ln Unit 202
- 1304 Snowberry Ln Unit 103
- 2037 Aster Ln
- 1998 Foxtail Ln Unit B
- 1388 Snowberry Ln
- 1025 Sparta Dr
- 1724 Steel St
- 1015-1035 S Boulder Rd
- 745 E South Boulder Rd
- 1931 Centennial Dr Unit 1931
- 1140 Cannon St
- 1536 Sanitas Ln
- 1508 Sanitas Ln
- 1007 Leonard Ln
- 1612 Garfield Ave
- 860 W Baseline Rd
- 1105 Bacchus Dr
- 1602 Garfield Ave Unit 11
- 1205 Centaur Cir
- 1606 Cottonwood Dr Unit 16S
- 242 Pheasant Run Unit A
- 107 N Public Rd Unit C
- 104 E Chester St Unit B
- 235 E South Boulder Rd
