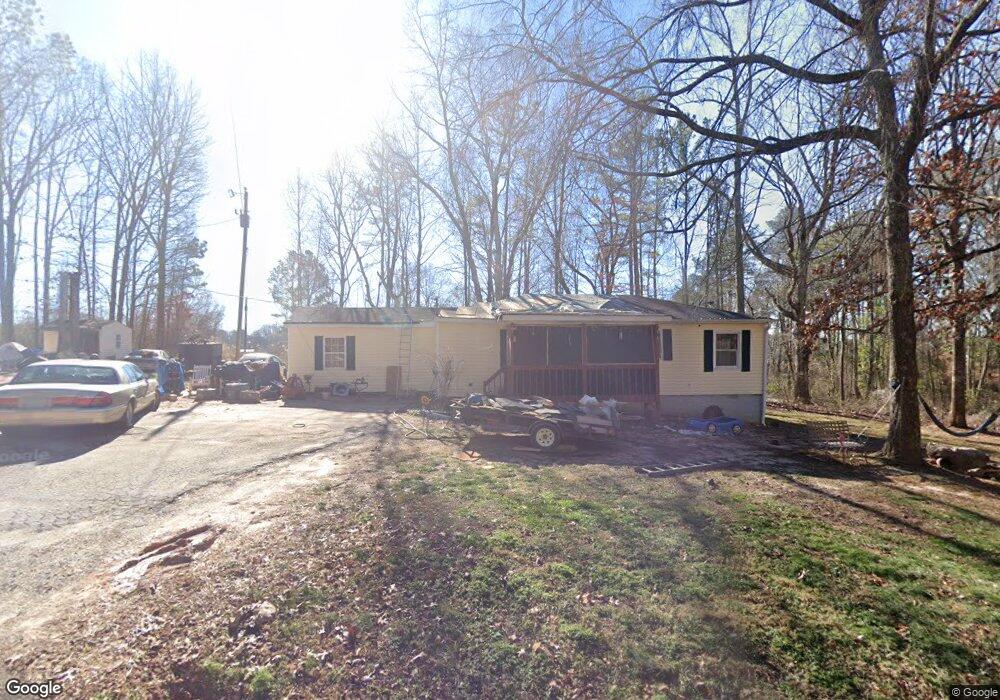
569 Honeysuckle Ln Temple, GA 30179
Estimated Value: $221,657 - $315,000
3
Beds
1
Bath
1,426
Sq Ft
$191/Sq Ft
Est. Value
About This Home
This home is located at 569 Honeysuckle Ln, Temple, GA 30179 and is currently estimated at $272,664, approximately $191 per square foot. 569 Honeysuckle Ln is a home located in Paulding County with nearby schools including Union Elementary School, Carl Scoggins Sr. Middle School, and South Paulding High School.
Ownership History
Date
Name
Owned For
Owner Type
Purchase Details
Closed on
Jan 3, 2018
Sold by
Villalpando Heidi Lynn
Bought by
Hendrix Donna L
Current Estimated Value
Purchase Details
Closed on
Oct 8, 2013
Sold by
Villalpando Daniel G
Bought by
Villalpando Heidi Lynn
Purchase Details
Closed on
Nov 12, 2009
Sold by
Federal Home Loan Mortgage Corporation
Bought by
Villalpando Daniel G
Purchase Details
Closed on
Jul 7, 2009
Sold by
Wells Fargo Bk Na
Bought by
Federal Home Loan Mortgage Corporation
Purchase Details
Closed on
Jul 9, 2004
Sold by
Couch Danny
Bought by
Decker Shalon K
Home Financials for this Owner
Home Financials are based on the most recent Mortgage that was taken out on this home.
Original Mortgage
$81,000
Interest Rate
5.63%
Mortgage Type
New Conventional
Purchase Details
Closed on
Apr 28, 2002
Sold by
Jdl Inc
Purchase Details
Closed on
Jul 17, 1992
Sold by
Largin Joe D
Purchase Details
Closed on
Mar 19, 1992
Sold by
Largin Joe D
Create a Home Valuation Report for This Property
The Home Valuation Report is an in-depth analysis detailing your home's value as well as a comparison with similar homes in the area
Home Values in the Area
Average Home Value in this Area
Purchase History
| Date | Buyer | Sale Price | Title Company |
|---|---|---|---|
| Hendrix Donna L | $12,600 | -- | |
| Villalpando Heidi Lynn | -- | -- | |
| Villalpando Heid Lynn | -- | -- | |
| Villalpando Daniel G | -- | -- | |
| -- | $26,000 | -- | |
| Federal Home Loan Mortgage Corporation | -- | -- | |
| Wells Fargo Bk Na | $70,000 | -- | |
| -- | $70,000 | -- | |
| Decker Shalon K | $81,000 | -- | |
| -- | $81,000 | -- | |
| -- | $50,000 | -- | |
| -- | -- | -- | |
| -- | $5,000 | -- |
Source: Public Records
Mortgage History
| Date | Status | Borrower | Loan Amount |
|---|---|---|---|
| Previous Owner | -- | $81,000 |
Source: Public Records
Tax History
| Year | Tax Paid | Tax Assessment Tax Assessment Total Assessment is a certain percentage of the fair market value that is determined by local assessors to be the total taxable value of land and additions on the property. | Land | Improvement |
|---|---|---|---|---|
| 2025 | $1,469 | $62,380 | $10,120 | $52,260 |
| 2024 | $1,519 | $64,304 | $10,640 | $53,664 |
| 2023 | $1,524 | $60,980 | $10,120 | $50,860 |
| 2022 | $1,360 | $54,028 | $10,000 | $44,028 |
| 2021 | $1,166 | $41,988 | $7,160 | $34,828 |
| 2020 | $1,124 | $39,712 | $6,120 | $33,592 |
| 2019 | $152 | $35,348 | $5,320 | $30,028 |
| 2018 | $882 | $29,268 | $5,280 | $23,988 |
| 2017 | $822 | $26,908 | $5,280 | $21,628 |
| 2016 | $684 | $22,620 | $5,680 | $16,940 |
| 2015 | $648 | $21,044 | $5,680 | $15,364 |
| 2014 | $573 | $18,164 | $4,880 | $13,284 |
| 2013 | -- | $15,520 | $4,880 | $10,640 |
Source: Public Records
Map
Nearby Homes
- 689 Hardin Rd
- 265 Honeysuckle Ln
- 250 Carter Creek Dr
- 718 Baskin Rd
- 10331 Buchanan Hwy
- 221 Pleasant Way
- 170 Baskin Rd
- 11070 Buchanan Hwy
- 391 Mulberry Rock Rd
- 200 Bear Ln
- 128 Tanner Dr
- 104 Federal Path
- 601 Birchwood Dr
- 2522 Honeysuckle Ln
- 0 Rustin Dr Unit 10617842
- 0 Rustin Dr Unit 7657021
- 0 Courthouse Park Dr Unit 10491475
- 510 Orchard Dr
- 209 Ivey Terrace Unit 28
- 209 Ivey Terrace
- 9 Honeysuckle Ln
- 527 Honeysuckle Ln
- 498 Honeysuckle Ln
- 649 Honeysuckle Ln
- 479 Honeysuckle Ln
- 603 Hardin Rd
- 712 Honeysuckle Ln
- 333 Hardin Rd
- 433 Honeysuckle Ln
- 738 Honeysuckle Ln
- 743 Honeysuckle Ln
- 349 Honeysuckle Ln
- 230 Hannah Rd
- 826 Honeysuckle Ln
- 631 Hardin Rd
- 691 Hardin Rd
- 324 Honeysuckle Ln
- 434 Honeysuckle Ln
- 293 Honeysuckle Ln
- 845 Honeysuckle Ln