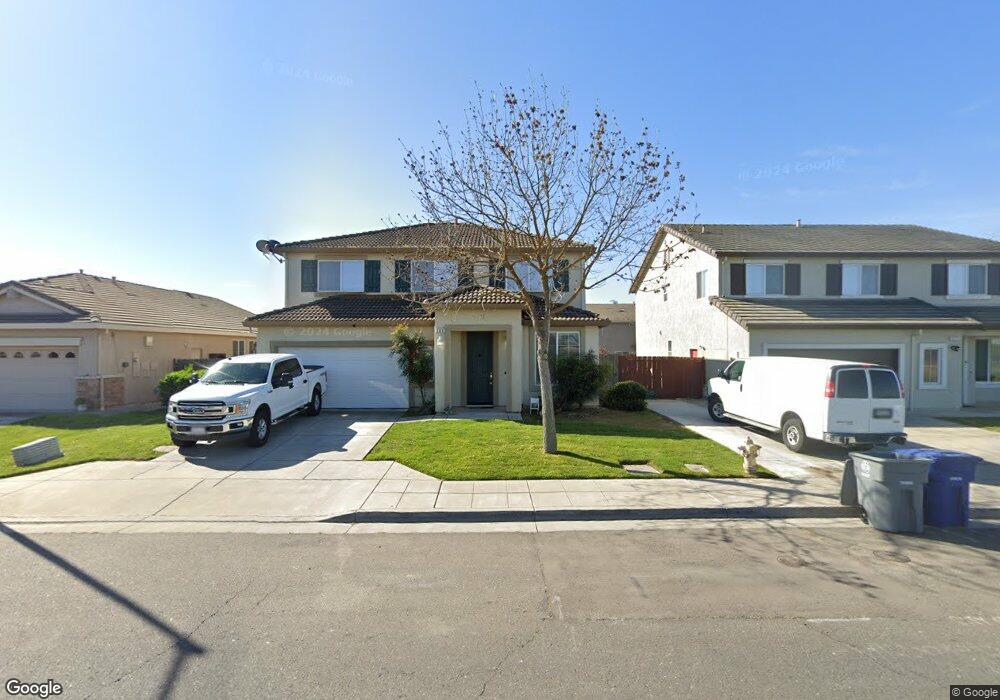
569 Howell Rd Chowchilla, CA 93610
Estimated Value: $399,000 - $420,000
3
Beds
3
Baths
2,271
Sq Ft
$180/Sq Ft
Est. Value
About This Home
This home is located at 569 Howell Rd, Chowchilla, CA 93610 and is currently estimated at $409,592, approximately $180 per square foot. 569 Howell Rd is a home located in Madera County with nearby schools including Merle L. Fuller Elementary School, Stephens Elementary School, and Ronald Reagan Elementary School.
Ownership History
Date
Name
Owned For
Owner Type
Purchase Details
Closed on
Jun 9, 2009
Sold by
Citimortgage Inc
Bought by
Souza Anthony C
Current Estimated Value
Home Financials for this Owner
Home Financials are based on the most recent Mortgage that was taken out on this home.
Original Mortgage
$112,800
Outstanding Balance
$71,499
Interest Rate
4.83%
Mortgage Type
Purchase Money Mortgage
Estimated Equity
$338,093
Purchase Details
Closed on
Nov 28, 2008
Sold by
Vazquez Rosalio O
Bought by
Citimortgage Inc
Purchase Details
Closed on
Mar 24, 2005
Sold by
Hofmann Construction Co
Bought by
Vazquez Rosalio O
Home Financials for this Owner
Home Financials are based on the most recent Mortgage that was taken out on this home.
Original Mortgage
$240,200
Interest Rate
5.37%
Mortgage Type
Purchase Money Mortgage
Create a Home Valuation Report for This Property
The Home Valuation Report is an in-depth analysis detailing your home's value as well as a comparison with similar homes in the area
Home Values in the Area
Average Home Value in this Area
Purchase History
| Date | Buyer | Sale Price | Title Company |
|---|---|---|---|
| Souza Anthony C | $141,000 | First American Title Company | |
| Citimortgage Inc | $77,527 | First American Title Company | |
| Vazquez Rosalio O | $300,500 | First American Title |
Source: Public Records
Mortgage History
| Date | Status | Borrower | Loan Amount |
|---|---|---|---|
| Open | Souza Anthony C | $112,800 | |
| Previous Owner | Vazquez Rosalio O | $240,200 | |
| Closed | Vazquez Rosalio O | $30,050 |
Source: Public Records
Tax History
| Year | Tax Paid | Tax Assessment Tax Assessment Total Assessment is a certain percentage of the fair market value that is determined by local assessors to be the total taxable value of land and additions on the property. | Land | Improvement |
|---|---|---|---|---|
| 2025 | $2,060 | $181,554 | $38,623 | $142,931 |
| 2023 | $2,060 | $174,506 | $37,124 | $137,382 |
| 2022 | $1,933 | $171,086 | $36,397 | $134,689 |
| 2021 | $1,908 | $167,733 | $35,684 | $132,049 |
| 2020 | $1,862 | $166,014 | $35,319 | $130,695 |
| 2019 | $1,847 | $162,760 | $34,627 | $128,133 |
| 2018 | $1,809 | $159,570 | $33,949 | $125,621 |
| 2017 | $1,783 | $156,442 | $33,284 | $123,158 |
| 2016 | $1,702 | $153,376 | $32,632 | $120,744 |
| 2015 | $1,683 | $151,073 | $32,142 | $118,931 |
| 2014 | $1,654 | $148,115 | $31,513 | $116,602 |
Source: Public Records
Map
Nearby Homes
- 510 Parkridge Dr
- 175 Oleander Dr
- 1604 Parkridge Dr
- 881 Gill Way
- 1312 Ventura Ave
- 105 Cedar Ct
- 1116 Sonoma Ave
- 0 Avenue 25
- 917 Amador St
- 808 Ventura Ave
- 1108 Kings Ave
- 904 Riverside Ave
- 801 Riverside Ave
- 609 Monterey Ave
- 900 Trinity Ave
- 2103 Kennedy Ct
- 1105 Orange Ave
- 212 Sonoma Ave
- 201 Monterey Ave
- 446 Trinity Ave
Your Personal Tour Guide
Ask me questions while you tour the home.