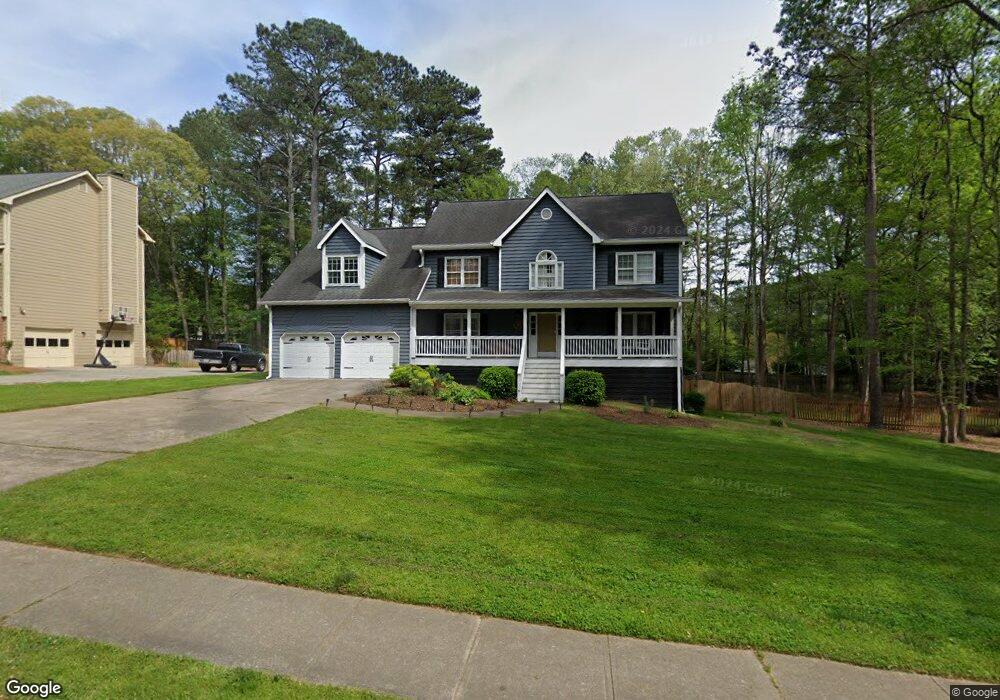
569 Lees Trace SW Marietta, GA 30064
Southwestern Marietta NeighborhoodEstimated Value: $586,276 - $632,000
4
Beds
3
Baths
2,817
Sq Ft
$215/Sq Ft
Est. Value
About This Home
This home is located at 569 Lees Trace SW, Marietta, GA 30064 and is currently estimated at $604,569, approximately $214 per square foot. 569 Lees Trace SW is a home located in Cobb County with nearby schools including A.L. Burruss Elementary School, Marietta Sixth Grade Academy, and Marietta Middle School.
Ownership History
Date
Name
Owned For
Owner Type
Purchase Details
Closed on
Feb 12, 2019
Sold by
Parrish Wesley T
Bought by
Parrish Dorothy Victoria
Current Estimated Value
Home Financials for this Owner
Home Financials are based on the most recent Mortgage that was taken out on this home.
Original Mortgage
$146,000
Outstanding Balance
$127,837
Interest Rate
4.4%
Mortgage Type
New Conventional
Estimated Equity
$476,732
Purchase Details
Closed on
Oct 31, 2007
Sold by
Albela Carmen
Bought by
Parrish Wesley T
Home Financials for this Owner
Home Financials are based on the most recent Mortgage that was taken out on this home.
Original Mortgage
$214,000
Interest Rate
5.94%
Mortgage Type
New Conventional
Purchase Details
Closed on
Oct 1, 1999
Sold by
Vaughan Harold G
Bought by
Vaughan Harold G and Vaughan Kate H
Home Financials for this Owner
Home Financials are based on the most recent Mortgage that was taken out on this home.
Original Mortgage
$151,200
Interest Rate
7.89%
Mortgage Type
New Conventional
Create a Home Valuation Report for This Property
The Home Valuation Report is an in-depth analysis detailing your home's value as well as a comparison with similar homes in the area
Home Values in the Area
Average Home Value in this Area
Purchase History
| Date | Buyer | Sale Price | Title Company |
|---|---|---|---|
| Parrish Dorothy Victoria | -- | -- | |
| Parrish Wesley T | $267,500 | -- | |
| Vaughan Harold G | -- | -- | |
| Vaughan Harold G | $189,000 | -- |
Source: Public Records
Mortgage History
| Date | Status | Borrower | Loan Amount |
|---|---|---|---|
| Open | Parrish Dorothy Victoria | $146,000 | |
| Previous Owner | Parrish Wesley T | $214,000 | |
| Previous Owner | Vaughan Harold G | $151,200 |
Source: Public Records
Tax History Compared to Growth
Tax History
| Year | Tax Paid | Tax Assessment Tax Assessment Total Assessment is a certain percentage of the fair market value that is determined by local assessors to be the total taxable value of land and additions on the property. | Land | Improvement |
|---|---|---|---|---|
| 2025 | $835 | $230,040 | $52,000 | $178,040 |
| 2024 | $835 | $230,040 | $52,000 | $178,040 |
| 2023 | $683 | $184,720 | $46,000 | $138,720 |
| 2022 | $835 | $136,640 | $29,800 | $106,840 |
| 2021 | $853 | $136,640 | $29,800 | $106,840 |
| 2020 | $852 | $126,648 | $29,800 | $96,848 |
| 2019 | $852 | $126,648 | $29,800 | $96,848 |
| 2018 | $850 | $115,980 | $28,000 | $87,980 |
| 2017 | $683 | $115,980 | $28,000 | $87,980 |
| 2016 | $683 | $110,344 | $28,000 | $82,344 |
| 2015 | $705 | $103,532 | $32,300 | $71,232 |
| 2014 | $729 | $103,532 | $0 | $0 |
Source: Public Records
Map
Nearby Homes
- 1198 Seminary Dr SW
- 652 Trailwood Ln SW
- 1047 Chestnut Hill Cir SW
- 1211 Cliffpine Ct SW
- 1410 Dallas Cir SW
- 332 Rockmann Ln SW
- 988 Grantham Way SW
- 1161 Rockmann Terrace SW
- 560 Manning Rd SW
- 1025 Denmeade Walk SW
- 805 Manning Way SW
- 594 Manning Rd SW
- 818 Manning Way SW Unit 1
- 1121 Cannongate Crossing SW
- 1017 Cannongate Crossing SW
- 1011 Cannongate Crossing SW
- 839 Manning Villas Ct SW
- 563 Lees Trace SW
- 571 Lees Trace SW
- 568 Lees Trace SW
- 564 Lees Trace SW
- 560 Lees Trace SW
- 573 Lees Trace SW
- 1164 Chestnut Hill Cir SW
- 553 Lees Trace SW
- 1158 Chestnut Hill Cir SW
- 556 Lees Trace SW
- 549 Lees Trace SW
- 576 Lees Trace SW
- 1167 Harrowgrove Ct SW
- 577 Lees Trace SW
- 1152 Chestnut Hill Cir SW
- 552 Lees Trace SW
- 1105 Autumn Chase Ct SW
- 541 Lees Trace SW
- 1163 Harrowgrove Ct SW
- 1110 Parkwind Way SW