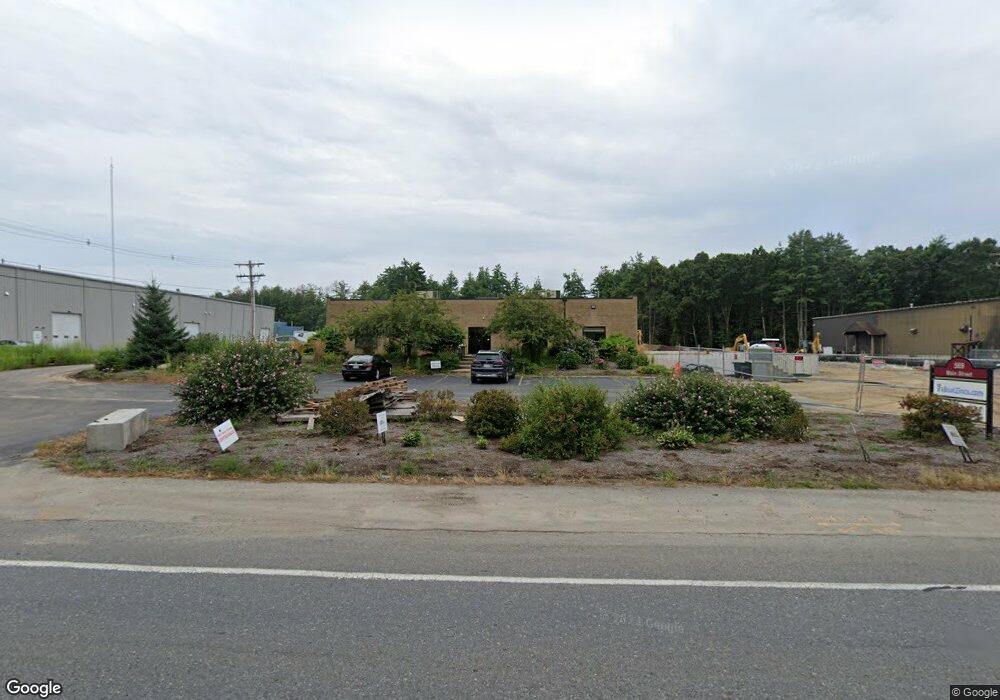
569 Main St Hudson, MA 01749
Lake Boon NeighborhoodEstimated Value: $2,344,724
3
Beds
1
Bath
18,040
Sq Ft
$130/Sq Ft
Est. Value
About This Home
This home is located at 569 Main St, Hudson, MA 01749 and is currently estimated at $2,344,724, approximately $129 per square foot. 569 Main St is a home located in Middlesex County with nearby schools including David J. Quinn Middle School, Hudson High School, and First Steps Children's Center.
Ownership History
Date
Name
Owned For
Owner Type
Purchase Details
Closed on
Jun 12, 2015
Sold by
Kane Shilrey M Est
Bought by
Most Noble Llc
Current Estimated Value
Home Financials for this Owner
Home Financials are based on the most recent Mortgage that was taken out on this home.
Original Mortgage
$900,000
Outstanding Balance
$694,577
Interest Rate
3.65%
Mortgage Type
Commercial
Estimated Equity
$1,650,147
Create a Home Valuation Report for This Property
The Home Valuation Report is an in-depth analysis detailing your home's value as well as a comparison with similar homes in the area
Home Values in the Area
Average Home Value in this Area
Purchase History
| Date | Buyer | Sale Price | Title Company |
|---|---|---|---|
| Most Noble Llc | $1,200,000 | -- |
Source: Public Records
Mortgage History
| Date | Status | Borrower | Loan Amount |
|---|---|---|---|
| Open | Most Noble Llc | $900,000 |
Source: Public Records
Tax History Compared to Growth
Tax History
| Year | Tax Paid | Tax Assessment Tax Assessment Total Assessment is a certain percentage of the fair market value that is determined by local assessors to be the total taxable value of land and additions on the property. | Land | Improvement |
|---|---|---|---|---|
| 2025 | $36,870 | $1,360,000 | $388,700 | $971,300 |
| 2024 | $35,929 | $1,306,500 | $369,100 | $937,400 |
| 2023 | $36,429 | $1,261,400 | $369,100 | $892,300 |
| 2022 | $38,435 | $1,216,300 | $369,100 | $847,200 |
| 2021 | $9,052 | $1,139,400 | $359,900 | $779,500 |
| 2020 | $38,459 | $1,161,200 | $356,400 | $804,800 |
| 2019 | $29,005 | $1,137,200 | $356,400 | $780,800 |
| 2018 | $39,701 | $1,128,500 | $347,700 | $780,800 |
| 2017 | $2,737 | $1,112,400 | $331,600 | $780,800 |
| 2016 | $28,437 | $804,000 | $331,600 | $472,400 |
| 2015 | $27,931 | $777,600 | $298,300 | $479,300 |
| 2014 | $27,381 | $794,800 | $298,300 | $496,500 |
Source: Public Records
Map
Nearby Homes
- 210 Barton Rd
- 4 Gately Ave
- 8 Town Line Rd Unit 4
- 1 Town Line Rd
- 1 Town Line Rd Unit 18
- Stockbridge South Shore Plan at Lakemont by Toll Brothers
- 10 Old County Rd Unit 19
- 10 Town Line Rd Unit 5
- 3 Shore Line Dr Unit 15
- 14 Old County Rd Unit 21
- 12 Town Line Rd Unit 6
- 10 Shoreline Dr Unit 12
- 8 Shoreline Dr Unit 11
- 51 Hale Rd
- 786 Main St
- 34 Hallock Point Rd
- 788 Main St
- 33A Russo Dr
- 168 Blanchette Dr
- 618 Sudbury St