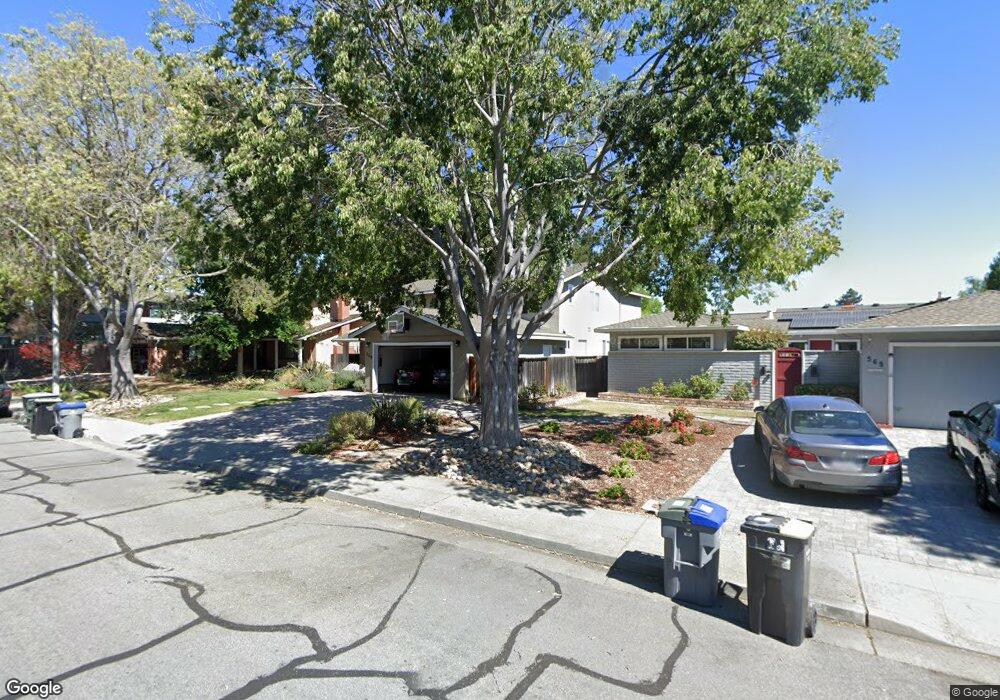
569 Middlebury Dr Sunnyvale, CA 94087
Estimated Value: $3,445,000 - $4,379,000
4
Beds
3
Baths
2,178
Sq Ft
$1,760/Sq Ft
Est. Value
About This Home
This home is located at 569 Middlebury Dr, Sunnyvale, CA 94087 and is currently estimated at $3,833,505, approximately $1,760 per square foot. 569 Middlebury Dr is a home located in Santa Clara County with nearby schools including Cumberland Elementary School, Sunnyvale Middle School, and Fremont High School.
Ownership History
Date
Name
Owned For
Owner Type
Purchase Details
Closed on
Oct 7, 2003
Sold by
Carlson Richard A and Carlson Michele K
Bought by
Carlson Richard A and Carlson Michele K
Current Estimated Value
Home Financials for this Owner
Home Financials are based on the most recent Mortgage that was taken out on this home.
Original Mortgage
$534,100
Outstanding Balance
$226,137
Interest Rate
4.87%
Mortgage Type
Purchase Money Mortgage
Estimated Equity
$3,607,368
Purchase Details
Closed on
Aug 9, 2001
Sold by
Walberg Scott T and Walberg Mary M
Bought by
Carlson Richard A and Carlson Michele K
Home Financials for this Owner
Home Financials are based on the most recent Mortgage that was taken out on this home.
Original Mortgage
$550,000
Interest Rate
7.19%
Create a Home Valuation Report for This Property
The Home Valuation Report is an in-depth analysis detailing your home's value as well as a comparison with similar homes in the area
Home Values in the Area
Average Home Value in this Area
Purchase History
| Date | Buyer | Sale Price | Title Company |
|---|---|---|---|
| Carlson Richard A | -- | First American Title Co | |
| Carlson Richard A | -- | First American Title Co | |
| Carlson Richard A | $1,050,000 | Alliance Title Company |
Source: Public Records
Mortgage History
| Date | Status | Borrower | Loan Amount |
|---|---|---|---|
| Open | Carlson Richard A | $534,100 | |
| Closed | Carlson Richard A | $550,000 |
Source: Public Records
Tax History Compared to Growth
Tax History
| Year | Tax Paid | Tax Assessment Tax Assessment Total Assessment is a certain percentage of the fair market value that is determined by local assessors to be the total taxable value of land and additions on the property. | Land | Improvement |
|---|---|---|---|---|
| 2025 | $17,688 | $1,551,155 | $960,241 | $590,914 |
| 2024 | $17,688 | $1,520,741 | $941,413 | $579,328 |
| 2023 | $17,481 | $1,490,923 | $922,954 | $567,969 |
| 2022 | $17,145 | $1,461,690 | $904,857 | $556,833 |
| 2021 | $16,969 | $1,433,030 | $887,115 | $545,915 |
| 2020 | $16,754 | $1,418,337 | $878,019 | $540,318 |
| 2019 | $16,376 | $1,390,527 | $860,803 | $529,724 |
| 2018 | $16,048 | $1,363,263 | $843,925 | $519,338 |
| 2017 | $15,841 | $1,336,533 | $827,378 | $509,155 |
| 2016 | $15,189 | $1,310,327 | $811,155 | $499,172 |
| 2015 | $15,281 | $1,290,645 | $798,971 | $491,674 |
| 2014 | $14,976 | $1,265,364 | $783,321 | $482,043 |
Source: Public Records
Map
Nearby Homes
- 128 Brahms Way
- 654 Princeton Dr
- 541 Holthouse Terrace
- 745 Reseda Dr
- 1262 Riesling Terrace
- 857 Peach Ave
- 839 Springfield Terrace
- Plan 7 at Vida
- Plan 4 at Vida
- Plan 2 at Vida
- Plan 8 at Vida
- Plan 1 at Vida
- Plan 3 at Vida
- Plan 5 at Vida
- Plan 6 at Vida
- 1308 Yarmouth Terrace
- 1304 Barbet Cir Unit 6
- 1304 Barbet Cir Unit 1
- 1303 Besra Terrace Unit 2
- 1303 Besra Terrace Unit 5
- 573 Middlebury Dr
- 565 Middlebury Dr
- 561 Middlebury Dr
- 572 Hyannis Dr
- 568 Hyannis Dr
- 576 Hyannis Dr
- 884 Tartarian Way
- 880 Tartarian Way
- 878 Tartarian Way
- 568 Middlebury Dr
- 564 Hyannis Dr
- 564 Middlebury Dr
- 572 Middlebury Dr
- 559 Middlebury Dr
- 560 Middlebury Dr
- 576 Middlebury Dr
- 874 Tartarian Way
- 560 Hyannis Dr
- 551 Middlebury Dr
- 556 Middlebury Dr