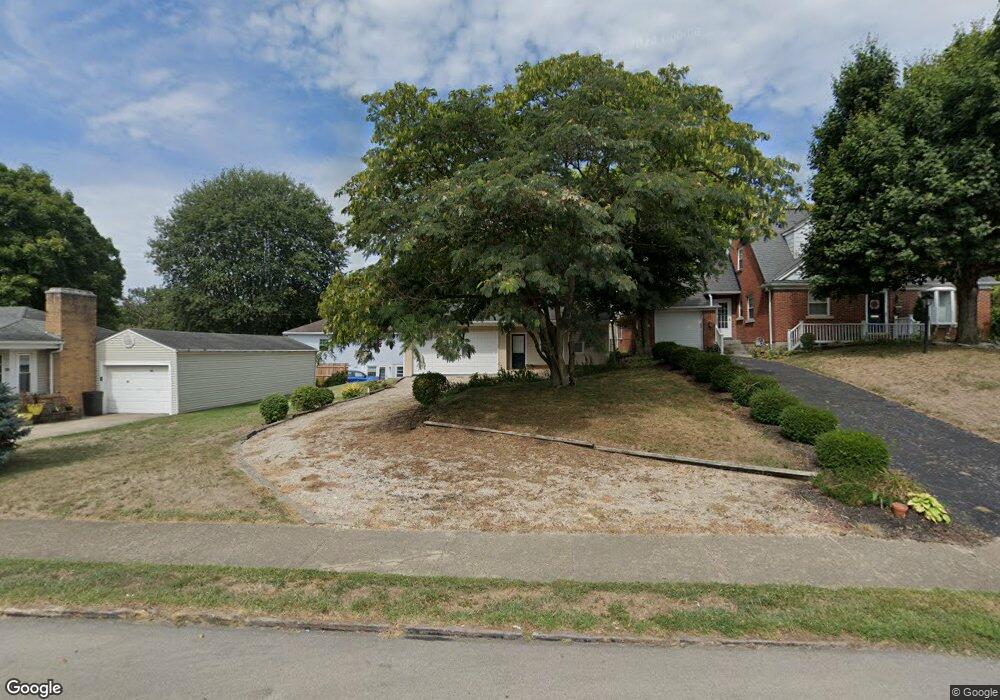
569 N Pickaway St Circleville, OH 43113
Estimated Value: $256,000 - $292,000
2
Beds
2
Baths
1,309
Sq Ft
$209/Sq Ft
Est. Value
About This Home
This home is located at 569 N Pickaway St, Circleville, OH 43113 and is currently estimated at $273,019, approximately $208 per square foot. 569 N Pickaway St is a home located in Pickaway County with nearby schools including Circleville Elementary School, Circleville High School, and New Hope Christian Academy.
Ownership History
Date
Name
Owned For
Owner Type
Purchase Details
Closed on
Jun 29, 2016
Sold by
Horstman Kevin P
Bought by
Twila Dicks
Current Estimated Value
Home Financials for this Owner
Home Financials are based on the most recent Mortgage that was taken out on this home.
Interest Rate
3.56%
Purchase Details
Closed on
Sep 9, 2010
Sold by
Secretary Of Veterans Affairs
Bought by
Horstman Kevin P and Parker Erin E
Home Financials for this Owner
Home Financials are based on the most recent Mortgage that was taken out on this home.
Original Mortgage
$114,951
Interest Rate
4.25%
Mortgage Type
FHA
Purchase Details
Closed on
Jun 7, 2010
Sold by
Gardner Robert E and Gardner Wendy K
Bought by
Secretary Of Veterans Affairs
Purchase Details
Closed on
Mar 31, 2006
Sold by
Spires Richard L and Spires Nora J
Bought by
Gardner Robert E and Gardner Wendy K
Home Financials for this Owner
Home Financials are based on the most recent Mortgage that was taken out on this home.
Original Mortgage
$168,591
Interest Rate
6.48%
Mortgage Type
VA
Create a Home Valuation Report for This Property
The Home Valuation Report is an in-depth analysis detailing your home's value as well as a comparison with similar homes in the area
Home Values in the Area
Average Home Value in this Area
Purchase History
| Date | Buyer | Sale Price | Title Company |
|---|---|---|---|
| Twila Dicks | $150,000 | -- | |
| Horstman Kevin P | -- | Clt | |
| Secretary Of Veterans Affairs | $83,334 | Attorney | |
| Gardner Robert E | $174,900 | Chicago Title |
Source: Public Records
Mortgage History
| Date | Status | Borrower | Loan Amount |
|---|---|---|---|
| Closed | Twila Dicks | -- | |
| Previous Owner | Horstman Kevin P | $114,951 | |
| Previous Owner | Gardner Robert E | $168,591 |
Source: Public Records
Tax History Compared to Growth
Tax History
| Year | Tax Paid | Tax Assessment Tax Assessment Total Assessment is a certain percentage of the fair market value that is determined by local assessors to be the total taxable value of land and additions on the property. | Land | Improvement |
|---|---|---|---|---|
| 2024 | -- | $67,530 | $6,010 | $61,520 |
| 2023 | $2,370 | $67,530 | $6,010 | $61,520 |
| 2022 | $2,071 | $46,860 | $5,030 | $41,830 |
| 2021 | $2,084 | $46,860 | $5,030 | $41,830 |
| 2020 | $2,084 | $46,860 | $5,030 | $41,830 |
| 2019 | $1,758 | $38,520 | $5,030 | $33,490 |
| 2018 | $1,883 | $38,520 | $5,030 | $33,490 |
| 2017 | $3,056 | $38,520 | $5,030 | $33,490 |
| 2016 | $1,659 | $33,690 | $3,770 | $29,920 |
| 2015 | $1,661 | $33,690 | $3,770 | $29,920 |
| 2014 | $1,655 | $33,690 | $3,770 | $29,920 |
| 2013 | $1,762 | $35,330 | $3,770 | $31,560 |
Source: Public Records
Map
Nearby Homes
- 556 N Pickaway St
- 528 N Court St
- 609 N Court St
- 118 Pleasant St
- 127 Collins Ct
- 308 Wedgewood Ct
- 386 Lawnwood Dr
- 842 Pershing Dr
- 156 W High St
- 452 Stella Ave
- 590 Garden Pkwy
- 152 Pinckney St
- 1040 Sunshine St
- 152 Griner Ave
- 382 E Franklin St
- 1520 Georgia Rd
- 461 Watt St
- 208 Moats Dr
- 334 Lancaster Pike
- 414 S Court St
- 567 N Pickaway St
- 570 Woodland Dr
- 563 N Pickaway St
- 574 Woodland Dr
- 572 N Pickaway St
- 574 N Pickaway St
- 564 N Pickaway St
- 579 N Pickaway St
- 555 N Pickaway St
- 558 N Pickaway St
- 139 Folsom Ave
- 573 Springhollow Rd
- 110 Johnson Dr
- 580 N Pickaway St
- 554 N Pickaway St
- 577 Springhollow Rd
- 146 Park Place
- 581 Springhollow Rd
- 569 Springhollow Rd
- 531 N Pickaway St