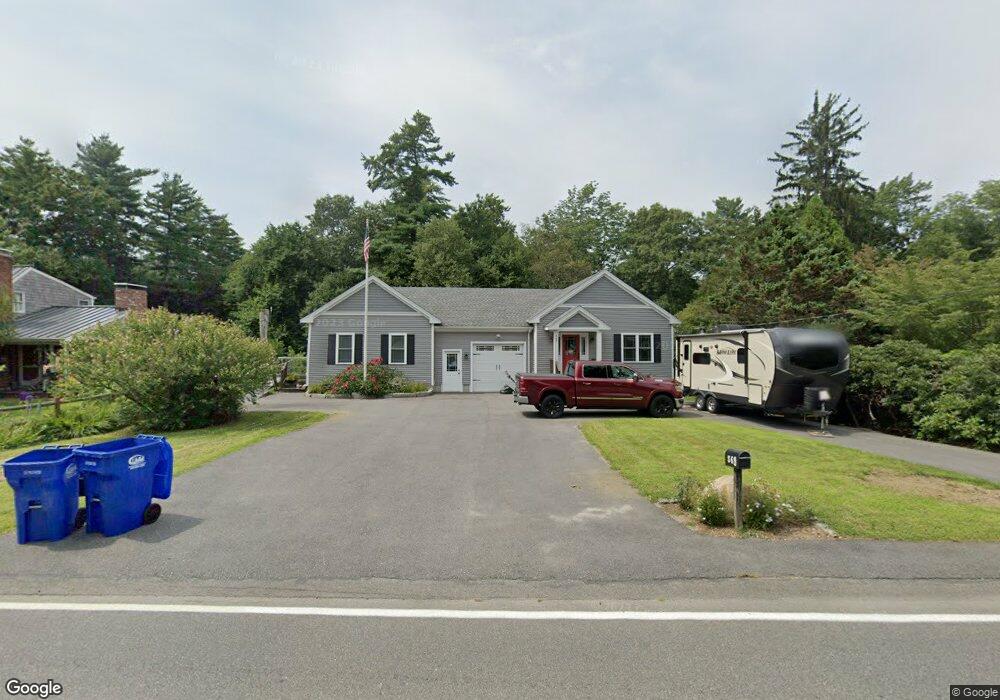
569 State St Hanson, MA 02341
Estimated Value: $688,000 - $762,000
3
Beds
2
Baths
1,559
Sq Ft
$471/Sq Ft
Est. Value
About This Home
This home is located at 569 State St, Hanson, MA 02341 and is currently estimated at $734,874, approximately $471 per square foot. 569 State St is a home located in Plymouth County with nearby schools including Cadence Academy Preschool - Hanover and Cardinal Cushing Centers.
Ownership History
Date
Name
Owned For
Owner Type
Purchase Details
Closed on
Apr 17, 2025
Sold by
Whiting Chad A and Whiting Kelley M
Bought by
Whiting Ft and Whiting
Current Estimated Value
Purchase Details
Closed on
May 30, 2014
Sold by
Whiting Chad and Whiting Kelley
Bought by
Kelley Cynthia
Home Financials for this Owner
Home Financials are based on the most recent Mortgage that was taken out on this home.
Original Mortgage
$270,000
Interest Rate
4.26%
Mortgage Type
New Conventional
Create a Home Valuation Report for This Property
The Home Valuation Report is an in-depth analysis detailing your home's value as well as a comparison with similar homes in the area
Home Values in the Area
Average Home Value in this Area
Purchase History
| Date | Buyer | Sale Price | Title Company |
|---|---|---|---|
| Whiting Ft | -- | None Available | |
| Whiting Ft | -- | None Available | |
| Whiting Ft | -- | None Available | |
| Kelley Cynthia | -- | -- | |
| Whiting Chad | -- | -- | |
| Whiting Chad | -- | -- | |
| Kelley Cynthia | -- | -- | |
| Whiting Chad | -- | -- |
Source: Public Records
Mortgage History
| Date | Status | Borrower | Loan Amount |
|---|---|---|---|
| Previous Owner | Whiting Chad | $270,000 |
Source: Public Records
Tax History Compared to Growth
Tax History
| Year | Tax Paid | Tax Assessment Tax Assessment Total Assessment is a certain percentage of the fair market value that is determined by local assessors to be the total taxable value of land and additions on the property. | Land | Improvement |
|---|---|---|---|---|
| 2025 | $9,497 | $709,800 | $187,000 | $522,800 |
| 2024 | $8,643 | $646,000 | $181,600 | $464,400 |
| 2023 | $8,372 | $590,400 | $181,600 | $408,800 |
| 2022 | $8,165 | $541,100 | $165,100 | $376,000 |
| 2021 | $7,396 | $489,800 | $158,800 | $331,000 |
| 2020 | $7,281 | $476,800 | $153,400 | $323,400 |
| 2019 | $6,954 | $447,800 | $150,400 | $297,400 |
| 2018 | $6,865 | $433,700 | $144,600 | $289,100 |
| 2017 | $6,694 | $418,900 | $137,700 | $281,200 |
| 2016 | $6,733 | $406,800 | $137,700 | $269,100 |
| 2015 | $2,192 | $137,700 | $137,700 | $0 |
Source: Public Records
Map
Nearby Homes
- Lot 22 Adams Cir
- 15 Elm Place
- 1251 Broadway
- 842 E Washington St
- 41 Gail Rd
- 553 Center St
- 114 Graham Hill Dr
- 436 Center St
- 37 Brook St
- 456 Gorwin Dr
- 7 Farmside Dr
- 51 Cervelli Farm Dr
- 37 Dr
- 23 Cervelli Farm Dr
- 38 Cervelli Farm Dr
- 9 Cervelli Farm Dr
- 250 Center St
- 418 E Washington St
- 154 Winter St
- 136 W Elm St