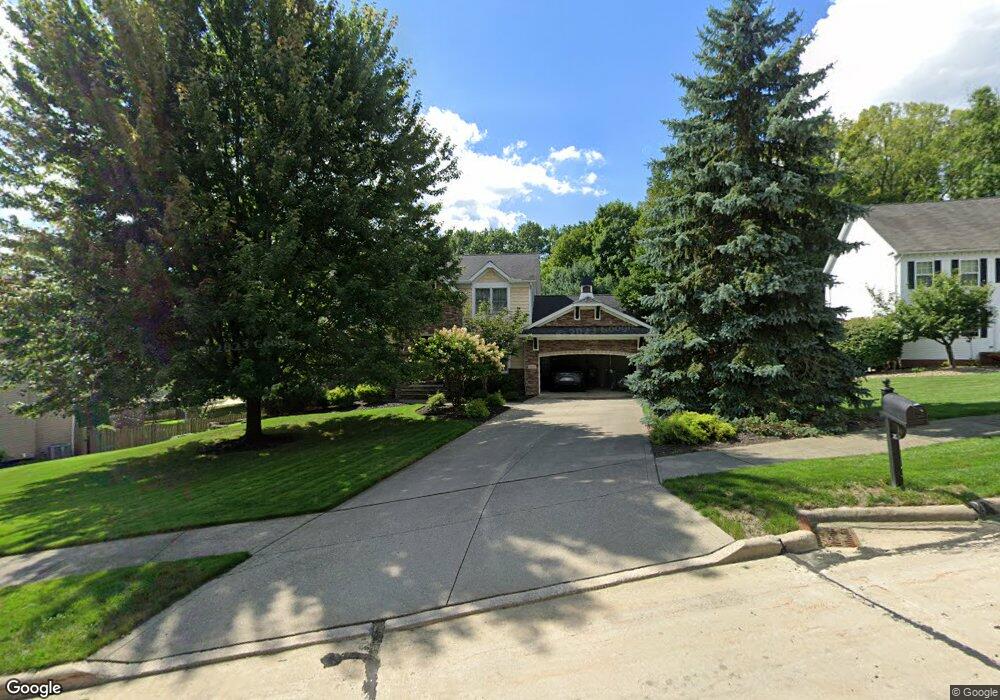
5690 Deer Creek Dr Willoughby, OH 44094
Downtown Willoughby NeighborhoodEstimated Value: $506,000 - $567,000
4
Beds
3
Baths
1,300
Sq Ft
$413/Sq Ft
Est. Value
About This Home
This home is located at 5690 Deer Creek Dr, Willoughby, OH 44094 and is currently estimated at $536,614, approximately $412 per square foot. 5690 Deer Creek Dr is a home located in Lake County with nearby schools including Edison Elementary School, Willoughby Middle School, and South High School.
Ownership History
Date
Name
Owned For
Owner Type
Purchase Details
Closed on
May 29, 2025
Sold by
Lachina Christopher
Bought by
Butzback Gary Alan and Butzback Benjamin Kathryn
Current Estimated Value
Home Financials for this Owner
Home Financials are based on the most recent Mortgage that was taken out on this home.
Original Mortgage
$450,000
Outstanding Balance
$448,849
Interest Rate
6.83%
Mortgage Type
New Conventional
Estimated Equity
$87,765
Purchase Details
Closed on
Jan 25, 2013
Sold by
Lachina Diana L
Bought by
Lachina Christopher
Home Financials for this Owner
Home Financials are based on the most recent Mortgage that was taken out on this home.
Original Mortgage
$196,261
Interest Rate
2.87%
Mortgage Type
FHA
Purchase Details
Closed on
Jan 1, 1990
Bought by
Deer Creek Dev Inc
Create a Home Valuation Report for This Property
The Home Valuation Report is an in-depth analysis detailing your home's value as well as a comparison with similar homes in the area
Home Values in the Area
Average Home Value in this Area
Purchase History
| Date | Buyer | Sale Price | Title Company |
|---|---|---|---|
| Butzback Gary Alan | $560,000 | Cleveland Home Title | |
| Lachina Christopher | -- | None Available | |
| Deer Creek Dev Inc | -- | -- |
Source: Public Records
Mortgage History
| Date | Status | Borrower | Loan Amount |
|---|---|---|---|
| Open | Butzback Gary Alan | $450,000 | |
| Previous Owner | Lachina Christopher | $196,261 |
Source: Public Records
Tax History Compared to Growth
Tax History
| Year | Tax Paid | Tax Assessment Tax Assessment Total Assessment is a certain percentage of the fair market value that is determined by local assessors to be the total taxable value of land and additions on the property. | Land | Improvement |
|---|---|---|---|---|
| 2024 | -- | $134,700 | $33,970 | $100,730 |
| 2023 | $9,994 | $105,550 | $27,130 | $78,420 |
| 2022 | $6,459 | $105,550 | $27,130 | $78,420 |
| 2021 | $6,488 | $105,550 | $27,130 | $78,420 |
| 2020 | $6,327 | $91,780 | $23,590 | $68,190 |
| 2019 | $5,868 | $91,780 | $23,590 | $68,190 |
| 2018 | $5,714 | $84,350 | $27,880 | $56,470 |
| 2017 | $5,648 | $84,350 | $27,880 | $56,470 |
| 2016 | $5,628 | $84,350 | $27,880 | $56,470 |
| 2015 | $5,486 | $84,350 | $27,880 | $56,470 |
| 2014 | $5,207 | $84,350 | $27,880 | $56,470 |
| 2013 | $5,210 | $84,350 | $27,880 | $56,470 |
Source: Public Records
Map
Nearby Homes
- 5549 Ericson Ln
- 35900 Jennie Ln
- 35005 Lisle Ct
- 36620 Ridge Rd
- 5317 Melody Ln
- 34840 Aspen Wood Ln
- 2344 Rivers Edge Dr
- 5520 Bretton Ct
- 34675 Oak Tree Dr
- 0 Hanna Rd
- 5463 Millwood Ln Unit 42C
- 5461 Millwood Ln
- 5072 Harmony Ln
- 5465 Millwood Ln Unit 40-C
- 34990 N Turtle Trail Unit C
- 34210 Beacon Dr
- 5785 Royal Dr
- 34616 Jude Ct
- 5510 Wildwood Ct Unit 81-A
- 34615 Ethan Way
- 5700 Deer Creek Dr
- 5680 Deer Creek Dr
- 36175 Fawn Hill Place
- 5670 Deer Creek Dr
- 5665 Deer Creek Dr
- 5675 Deer Creek Dr
- 35965 Timber Ridge Ln
- 36200 Fawn Hill Place
- 5660 Deer Creek Dr
- 5695 Deer Creek Dr
- 36250 Fawn Hill Place
- 35985 Timber Ridge Ln
- 5705 Deer Creek Dr
- 36230 Fawn Hill Place
- 35935 Timber Ridge Ln
- 5715 Deer Creek Dr
- 36100 Ridge Rd
- 5650 Deer Creek Dr
- 35895 Timber Ridge Ln
- 35980 Timber Ridge Ln