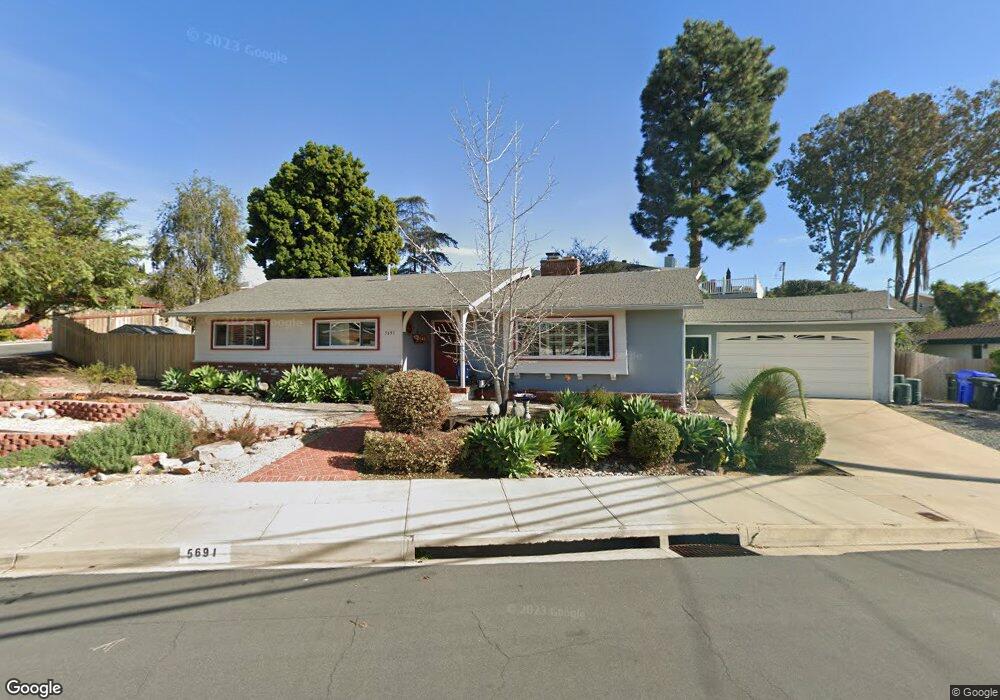
5691 Genoa Dr San Diego, CA 92120
Del Cerro NeighborhoodEstimated Value: $1,074,000 - $1,322,000
3
Beds
2
Baths
1,652
Sq Ft
$714/Sq Ft
Est. Value
About This Home
This home is located at 5691 Genoa Dr, San Diego, CA 92120 and is currently estimated at $1,180,291, approximately $714 per square foot. 5691 Genoa Dr is a home located in San Diego County with nearby schools including Hearst Elementary School, Lewis Middle School, and Patrick Henry High School.
Ownership History
Date
Name
Owned For
Owner Type
Purchase Details
Closed on
Jul 23, 2012
Sold by
Oberry Matthew P and Oberry Sherri L
Bought by
Oberry Matthew P and Oberry Sherri L
Current Estimated Value
Home Financials for this Owner
Home Financials are based on the most recent Mortgage that was taken out on this home.
Original Mortgage
$142,500
Interest Rate
3.65%
Mortgage Type
New Conventional
Purchase Details
Closed on
Jun 11, 2008
Sold by
Oberry Matthew P and Oberry Sherri
Bought by
Oberry Matthew P and Oberry Sherri L
Purchase Details
Closed on
Jul 30, 1997
Sold by
Washington Thomas S
Bought by
Oberry Matthew P and Oberry Sherri
Home Financials for this Owner
Home Financials are based on the most recent Mortgage that was taken out on this home.
Original Mortgage
$194,750
Interest Rate
7.61%
Purchase Details
Closed on
Jun 1, 1995
Sold by
Gaulin Richard Victor and Newton Eleanore Marie
Bought by
Washington Thomas S
Home Financials for this Owner
Home Financials are based on the most recent Mortgage that was taken out on this home.
Original Mortgage
$156,937
Interest Rate
7.62%
Mortgage Type
Assumption
Create a Home Valuation Report for This Property
The Home Valuation Report is an in-depth analysis detailing your home's value as well as a comparison with similar homes in the area
Home Values in the Area
Average Home Value in this Area
Purchase History
| Date | Buyer | Sale Price | Title Company |
|---|---|---|---|
| Oberry Matthew P | -- | Accommodation | |
| Oberry Matthew P | -- | Ticor Title Company | |
| Oberry Matthew P | -- | None Available | |
| Oberry Matthew P | $205,000 | Stewart Title Company | |
| Washington Thomas S | $205,000 | American Title Ins Co |
Source: Public Records
Mortgage History
| Date | Status | Borrower | Loan Amount |
|---|---|---|---|
| Closed | Oberry Matthew P | $142,500 | |
| Closed | Oberry Matthew P | $194,750 | |
| Previous Owner | Washington Thomas S | $156,937 |
Source: Public Records
Tax History Compared to Growth
Tax History
| Year | Tax Paid | Tax Assessment Tax Assessment Total Assessment is a certain percentage of the fair market value that is determined by local assessors to be the total taxable value of land and additions on the property. | Land | Improvement |
|---|---|---|---|---|
| 2025 | $3,990 | $335,600 | $191,600 | $144,000 |
| 2024 | $3,990 | $329,021 | $187,844 | $141,177 |
| 2023 | $3,900 | $322,570 | $184,161 | $138,409 |
| 2022 | $3,794 | $316,246 | $180,550 | $135,696 |
| 2021 | $3,767 | $310,046 | $177,010 | $133,036 |
| 2020 | $3,721 | $306,867 | $175,195 | $131,672 |
| 2019 | $3,653 | $300,851 | $171,760 | $129,091 |
| 2018 | $3,415 | $294,953 | $168,393 | $126,560 |
| 2017 | $3,332 | $289,171 | $165,092 | $124,079 |
| 2016 | $3,277 | $283,502 | $161,855 | $121,647 |
| 2015 | $3,146 | $272,349 | $159,424 | $112,925 |
| 2014 | $3,096 | $267,015 | $156,302 | $110,713 |
Source: Public Records
Map
Nearby Homes
- 6183 Rockhurst Dr
- 5858 Del Cerro Blvd
- 6016 Wenrich Place
- 5996 College Ave
- 6342 Lambda Dr
- 5968 Caminito de la Taza
- 5701 Madra Ave
- 5957 Caminito de la Taza
- 6510 Airoso Ave
- 5513 Adobe Falls Rd Unit 11
- 6347 Elmhurst Dr
- 6329 Caminito Estrellado
- 6517 Hillgrove Dr
- 6330 Wenrich Dr
- 5873 Madra Ave
- 6240 Bernadette Ln
- 6570 Hillgrove Dr
- 6457 Julie St
- 5540 Lindo Paseo Unit 19
- 6303 Caminito Tenedor
- 6111 Capri Dr
- 5675 Genoa Dr
- 6102 Capri Dr
- 6110 Capri Dr
- 5692 Helena Place
- 1Genoa Drive
- 6118 Capri Dr
- 5667 Genoa Dr
- 5690 Genoa Dr
- 5682 Helena Place
- 6126 Capri Dr
- 5704 Genoa Dr
- 5670 Genoa Dr
- 5733 Genoa Dr
- 5672 Helena Place
- 5659 Genoa Dr
- 6127 Del Cerro Blvd
- 6135 Del Cerro Blvd
- 6134 Capri Dr
- 6119 Del Cerro Blvd