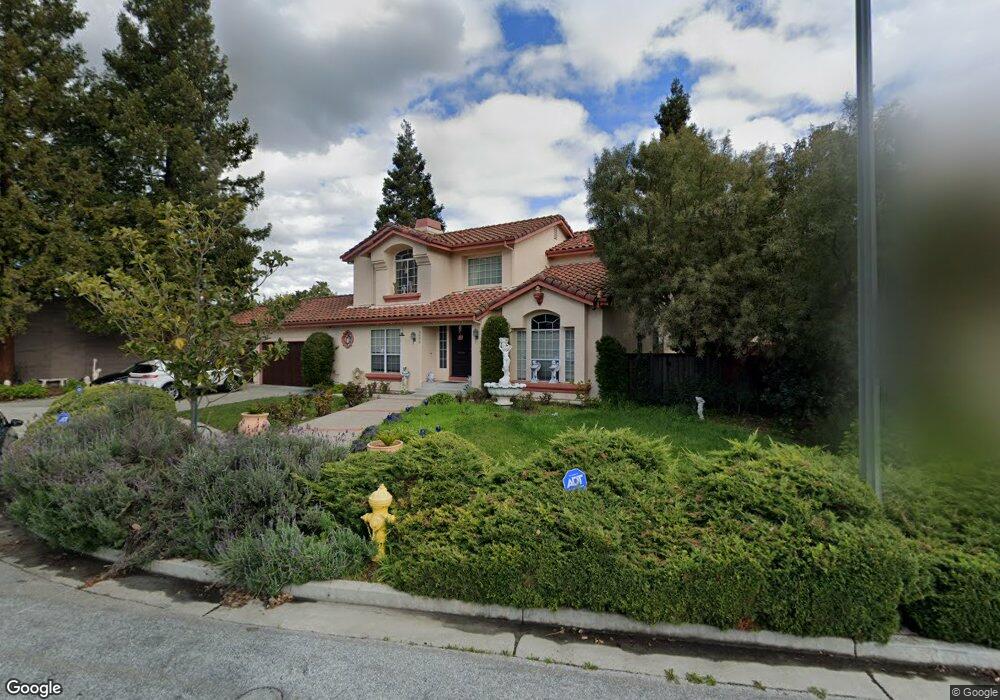
5692 Blackhawk Ct San Jose, CA 95123
Comanche NeighborhoodEstimated Value: $1,723,000 - $2,062,000
5
Beds
3
Baths
2,509
Sq Ft
$748/Sq Ft
Est. Value
About This Home
This home is located at 5692 Blackhawk Ct, San Jose, CA 95123 and is currently estimated at $1,875,951, approximately $747 per square foot. 5692 Blackhawk Ct is a home located in Santa Clara County with nearby schools including Frost (Earl) Elementary School, Herman (Leonard) Intermediate School, and Santa Teresa High School.
Ownership History
Date
Name
Owned For
Owner Type
Purchase Details
Closed on
Mar 20, 2002
Sold by
Garcia Frank A and Garcia Mary E
Bought by
Ozuna Humberto
Current Estimated Value
Home Financials for this Owner
Home Financials are based on the most recent Mortgage that was taken out on this home.
Original Mortgage
$258,000
Interest Rate
6.84%
Mortgage Type
Balloon
Create a Home Valuation Report for This Property
The Home Valuation Report is an in-depth analysis detailing your home's value as well as a comparison with similar homes in the area
Home Values in the Area
Average Home Value in this Area
Purchase History
| Date | Buyer | Sale Price | Title Company |
|---|---|---|---|
| Ozuna Humberto | $647,500 | Alliance Title Company |
Source: Public Records
Mortgage History
| Date | Status | Borrower | Loan Amount |
|---|---|---|---|
| Closed | Ozuna Humberto | $258,000 |
Source: Public Records
Tax History
| Year | Tax Paid | Tax Assessment Tax Assessment Total Assessment is a certain percentage of the fair market value that is determined by local assessors to be the total taxable value of land and additions on the property. | Land | Improvement |
|---|---|---|---|---|
| 2025 | $13,190 | $956,536 | $430,329 | $526,207 |
| 2024 | $13,190 | $937,782 | $421,892 | $515,890 |
| 2023 | $12,997 | $919,395 | $413,620 | $505,775 |
| 2022 | $12,919 | $901,368 | $405,510 | $495,858 |
| 2021 | $12,745 | $883,695 | $397,559 | $486,136 |
| 2020 | $12,478 | $874,635 | $393,483 | $481,152 |
| 2019 | $12,194 | $857,486 | $385,768 | $471,718 |
| 2018 | $12,118 | $840,673 | $378,204 | $462,469 |
| 2017 | $11,960 | $824,190 | $370,789 | $453,401 |
| 2016 | $11,382 | $808,030 | $363,519 | $444,511 |
| 2015 | $11,167 | $795,894 | $358,059 | $437,835 |
| 2014 | $10,247 | $777,500 | $349,800 | $427,700 |
Source: Public Records
Map
Nearby Homes
- 503 Chinook Ln
- 405 Don Fernando Way
- 5776 Arapaho Dr
- 5508 Sean Cir Unit 107
- 294 Tradewinds Dr Unit 4
- 5806 Blossom Ave
- 5477 Entrada Cedros
- 5459 Entrada Cedros
- 444 Roading Dr
- 310 Tradewinds Dr Unit 8
- 5537 Judith St Unit 1
- 5504 Don Marcello Ct
- 5558 Judith St Unit 1
- 266 Tradewinds Ct Unit 1
- 5577 Spinnaker Dr Unit 4
- 281 Tradewinds Dr Unit 5
- 281 Tradewinds Dr Unit 7
- 305 Tradewinds Dr Unit 5
- 305 Tradewinds Dr Unit 7
- 285 Tradewinds Dr Unit 6
Your Personal Tour Guide
Ask me questions while you tour the home.