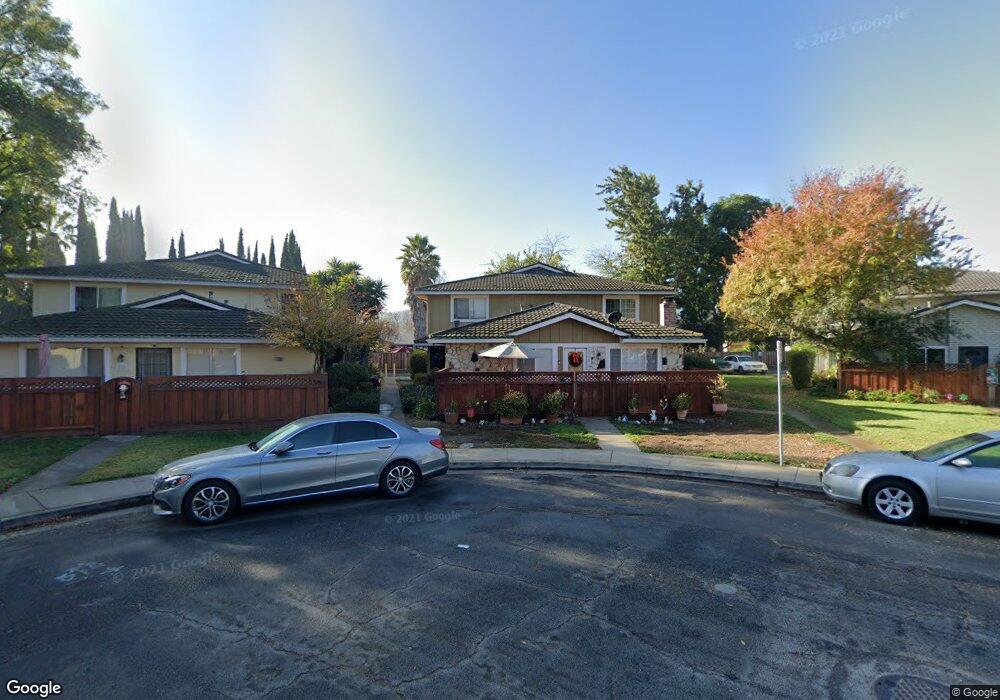
5692 Calmor Ct Unit 1 San Jose, CA 95123
McKuen NeighborhoodEstimated Value: $465,131 - $628,000
2
Beds
1
Bath
810
Sq Ft
$633/Sq Ft
Est. Value
About This Home
This home is located at 5692 Calmor Ct Unit 1, San Jose, CA 95123 and is currently estimated at $512,533, approximately $632 per square foot. 5692 Calmor Ct Unit 1 is a home located in Santa Clara County with nearby schools including Allen at Steinbeck, Castillero Middle School, and Gunderson High School.
Ownership History
Date
Name
Owned For
Owner Type
Purchase Details
Closed on
Oct 13, 2016
Sold by
Nemeth Laszlo L and Nemeth Kathleen E
Bought by
Nemeth Laszlo Lajos and Nemeth Kathleen Emese
Current Estimated Value
Purchase Details
Closed on
Nov 13, 1997
Sold by
Raia Frederick S and Raia Nancy
Bought by
Nemeth Laszlo L and Nemeth Kathleen E
Home Financials for this Owner
Home Financials are based on the most recent Mortgage that was taken out on this home.
Original Mortgage
$92,000
Interest Rate
7.23%
Purchase Details
Closed on
Apr 22, 1997
Sold by
Bergeron Karen M and Bergeron Karen M
Bought by
Raia Frederick S and Raia Nancy
Home Financials for this Owner
Home Financials are based on the most recent Mortgage that was taken out on this home.
Original Mortgage
$88,000
Interest Rate
7.86%
Create a Home Valuation Report for This Property
The Home Valuation Report is an in-depth analysis detailing your home's value as well as a comparison with similar homes in the area
Home Values in the Area
Average Home Value in this Area
Purchase History
| Date | Buyer | Sale Price | Title Company |
|---|---|---|---|
| Nemeth Laszlo Lajos | -- | None Available | |
| Nemeth Laszlo L | $115,000 | Old Republic Title Company | |
| Raia Frederick S | $110,000 | Old Republic Title Company | |
| Bergeron Davis Karen M | -- | Old Republic Title Company |
Source: Public Records
Mortgage History
| Date | Status | Borrower | Loan Amount |
|---|---|---|---|
| Closed | Nemeth Laszlo L | $92,000 | |
| Previous Owner | Raia Frederick S | $88,000 |
Source: Public Records
Tax History Compared to Growth
Tax History
| Year | Tax Paid | Tax Assessment Tax Assessment Total Assessment is a certain percentage of the fair market value that is determined by local assessors to be the total taxable value of land and additions on the property. | Land | Improvement |
|---|---|---|---|---|
| 2025 | $2,729 | $183,593 | $63,853 | $119,740 |
| 2024 | $2,729 | $179,994 | $62,601 | $117,393 |
| 2023 | $2,663 | $176,466 | $61,374 | $115,092 |
| 2022 | $2,659 | $173,007 | $60,171 | $112,836 |
| 2021 | $2,597 | $169,616 | $58,992 | $110,624 |
| 2020 | $2,558 | $167,878 | $58,388 | $109,490 |
| 2019 | $2,511 | $164,588 | $57,244 | $107,344 |
| 2018 | $2,485 | $161,362 | $56,122 | $105,240 |
| 2017 | $2,463 | $158,199 | $55,022 | $103,177 |
| 2016 | $2,347 | $155,098 | $53,944 | $101,154 |
| 2015 | $2,322 | $152,769 | $53,134 | $99,635 |
| 2014 | $2,250 | $149,778 | $52,094 | $97,684 |
Source: Public Records
Map
Nearby Homes
- 5701 Calmor Ave Unit 2
- 5707 Calmor Ave Unit 3
- 734 Pronto Dr
- 5660 Calmor Ave Unit 4
- 5870 Cabral Ave
- 5749 San Lorenzo Dr
- 5630 Allen Ave Unit 4
- 5629 Playa Del Rey Ct Unit 3
- 5629 Morton Way
- 845 Villa Teresa Way Unit 845
- 827 Villa Teresa Way Unit 827
- 896 Villa Teresa Way
- 882 Tallman Ct
- 5986 Loma Prieta Dr
- 5948 Garlough Dr
- 5521 Southcrest Way
- 5510 Dunsburry Way
- 732 Calero Ave
- 5981 Lake Hennessy Ct
- 775 Sunset Glen Dr
- 5692 Calmor Ct Unit 4
- 5692 Calmor Ct Unit 3
- 5692 Calmor Ct Unit 2
- 5696 Calmor Ct
- 5696 Calmor Ct Unit 4
- 5696 Calmor Ct Unit 3
- 5696 Calmor Ct Unit 2
- 5696 Calmor Ct Unit 1
- 5688 Calmor Ct Unit 4
- 5688 Calmor Ct Unit 3
- 5688 Calmor Ct Unit 2
- 5688 Calmor Ct Unit 1
- 723 Pronto Dr
- 719 Pronto Dr
- 5700 Calmor Ave Unit 4
- 5684 Calmor Ct Unit 2
- 5684 Calmor Ct Unit 3
- 5684 Calmor Ct Unit 2
- 5684 Calmor Ct Unit 1
- 5700 Calmor Ct Unit 4