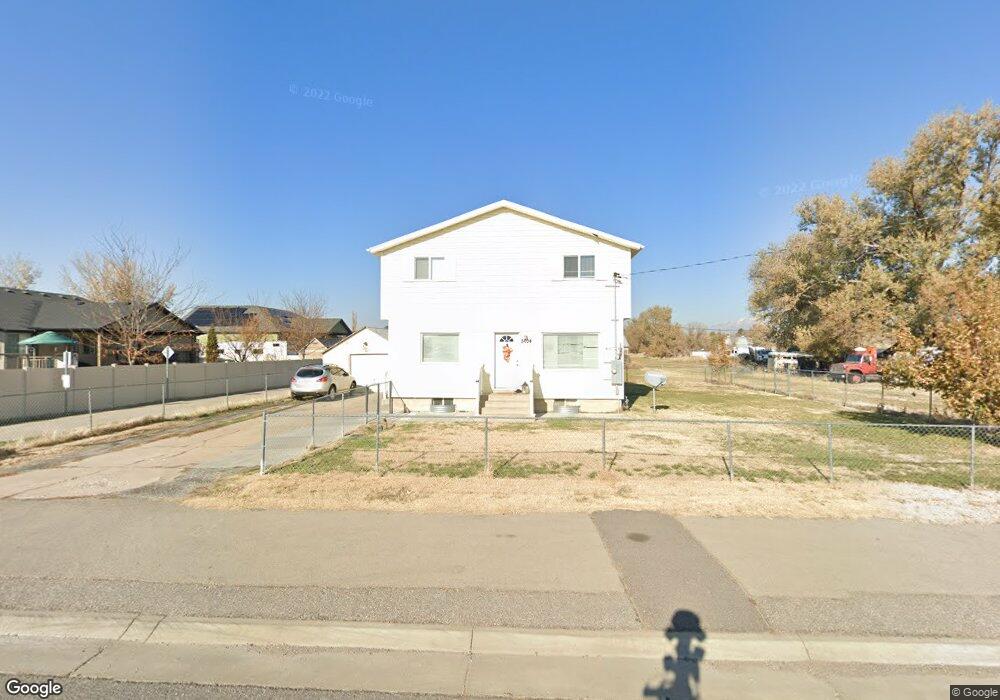
5694 W 5300 S Hooper, UT 84315
Estimated Value: $526,000 - $681,000
5
Beds
1
Bath
2,638
Sq Ft
$225/Sq Ft
Est. Value
About This Home
This home is located at 5694 W 5300 S, Hooper, UT 84315 and is currently estimated at $593,199, approximately $224 per square foot. 5694 W 5300 S is a home located in Weber County with nearby schools including Hooper Elementary School, Rocky Mountain Junior High School, and Quest Academy.
Ownership History
Date
Name
Owned For
Owner Type
Purchase Details
Closed on
Oct 22, 2004
Sold by
Us Bank Na
Bought by
Checketts Grant W and Checketts Randy
Current Estimated Value
Purchase Details
Closed on
Aug 12, 2004
Sold by
Maginnis Shawn and Maginnis Kirsten
Bought by
Us Bank Na and Csfb Abs Trust Series 2001-He30
Purchase Details
Closed on
Nov 3, 2003
Sold by
Maginnis Kirsten
Bought by
Maginnis Shawn
Purchase Details
Closed on
Aug 22, 2001
Sold by
Fotheringham Michael J
Bought by
Maginnis Shawn and Maginnis Kirsten
Home Financials for this Owner
Home Financials are based on the most recent Mortgage that was taken out on this home.
Original Mortgage
$104,800
Interest Rate
9.5%
Purchase Details
Closed on
May 2, 1998
Sold by
Fotheringham Michael J and Fotheringham Michael J
Bought by
Fotheringham Michael J
Home Financials for this Owner
Home Financials are based on the most recent Mortgage that was taken out on this home.
Original Mortgage
$42,000
Interest Rate
7.06%
Create a Home Valuation Report for This Property
The Home Valuation Report is an in-depth analysis detailing your home's value as well as a comparison with similar homes in the area
Home Values in the Area
Average Home Value in this Area
Purchase History
| Date | Buyer | Sale Price | Title Company |
|---|---|---|---|
| Checketts Grant W | -- | First Southwestern Title Age | |
| Us Bank Na | $111,600 | -- | |
| Maginnis Shawn | -- | -- | |
| Maginnis Shawn | -- | Backman Stewart Title | |
| Fotheringham Michael J | -- | Associated Title |
Source: Public Records
Mortgage History
| Date | Status | Borrower | Loan Amount |
|---|---|---|---|
| Previous Owner | Maginnis Shawn | $104,800 | |
| Previous Owner | Fotheringham Michael J | $42,000 |
Source: Public Records
Tax History
| Year | Tax Paid | Tax Assessment Tax Assessment Total Assessment is a certain percentage of the fair market value that is determined by local assessors to be the total taxable value of land and additions on the property. | Land | Improvement |
|---|---|---|---|---|
| 2025 | $2,897 | $466,169 | $219,965 | $246,204 |
| 2024 | $2,784 | $458,998 | $219,965 | $239,033 |
| 2023 | $2,988 | $500,000 | $249,996 | $250,004 |
| 2022 | $3,057 | $522,998 | $205,003 | $317,995 |
| 2021 | $2,505 | $395,001 | $130,068 | $264,933 |
| 2020 | $2,456 | $353,002 | $110,008 | $242,994 |
| 2019 | $2,338 | $318,002 | $83,000 | $235,002 |
| 2018 | $2,166 | $280,001 | $83,000 | $197,001 |
| 2017 | $1,786 | $224,000 | $78,000 | $146,000 |
| 2016 | $1,587 | $114,691 | $39,798 | $74,893 |
| 2015 | $1,560 | $111,125 | $39,798 | $71,327 |
| 2014 | $1,540 | $106,717 | $44,150 | $62,567 |
Source: Public Records
Map
Nearby Homes
- 5731 W 4100 S
- 5777 W 4100 S
- 6014 W 5300 S
- 5603 W 5600 S
- 0 W 5500 S
- 6042 W 5700 S
- 3664 S 5400 W Unit 13
- 5035 S 6150 W
- 5957 W 4700 S
- 3729 S 5600 W Unit 6
- 3672 S 5600 W Unit 23
- 3720 S 5600 W Unit 2
- 3732 S 5600 W Unit 3
- 3719 S 5600 W Unit 7
- 5785 S 6000 W
- 6030 W 5800 S
- 6036 W 4700 S
- 4879 S 5050 W
- 4836 S 5050 W
- 6237 W 4600 S
- 5294 S 5725 W
- 5674 W 5300 S
- 5691 W 5300 S
- 5274 S 5725 W
- 5274 S 5725 W Unit 51
- 5664 W 5300 S
- 5675 W 5300 S
- 5675 W 5300 S Unit 2
- 5661 W 5300 S
- 5732 W 5300 S
- 5732 W 5300 S Unit 38
- 5654 W 5300 S
- 5254 S 5725 W
- 5640 W 5300 S
- 5640 W 5300 S
- 5746 W 5300 S
- 5746 W 5300 S Unit 37
- 5733 W 5200 S
- 5630 W 5300 S
- 5747 W 5200 S
Your Personal Tour Guide
Ask me questions while you tour the home.