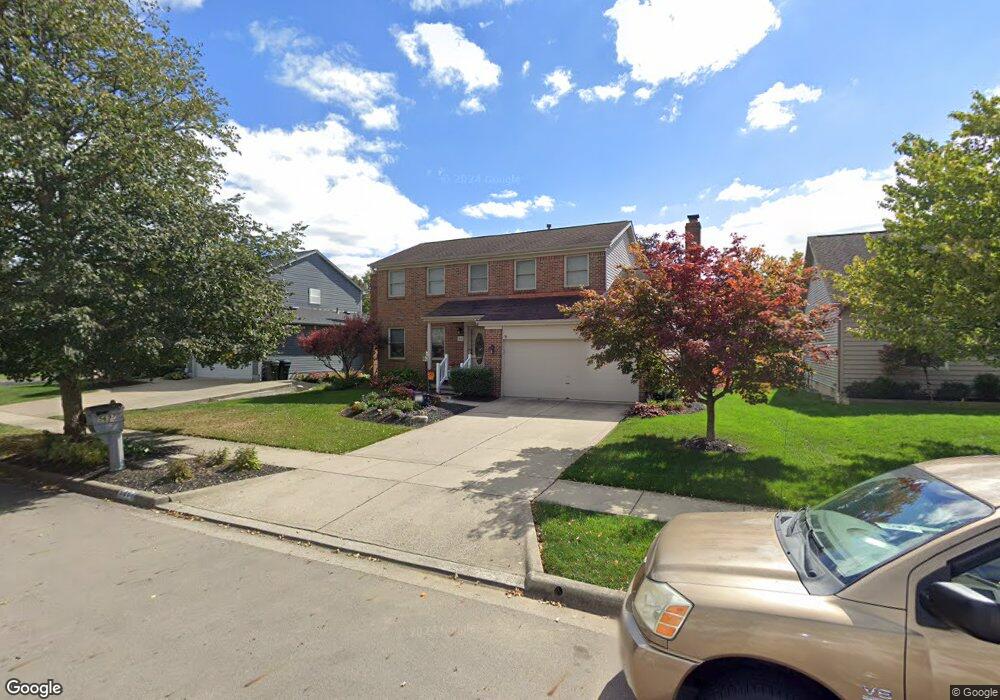
5697 Moonpenny Ln Hilliard, OH 43026
Cross Creek NeighborhoodEstimated Value: $410,000 - $455,000
4
Beds
3
Baths
1,820
Sq Ft
$235/Sq Ft
Est. Value
About This Home
This home is located at 5697 Moonpenny Ln, Hilliard, OH 43026 and is currently estimated at $428,389, approximately $235 per square foot. 5697 Moonpenny Ln is a home located in Franklin County with nearby schools including Scioto Darby Elementary School, Hilliard Station Sixth Grade Elementary School, and Hilliard Heritage Middle School.
Ownership History
Date
Name
Owned For
Owner Type
Purchase Details
Closed on
Jan 21, 2008
Sold by
Davidson Phillips Inc
Bought by
Thieman Celeste M
Current Estimated Value
Purchase Details
Closed on
Mar 2, 2000
Sold by
Boskovich Stanley J and Boskovich Kathryn A
Bought by
Healy Robert L and Healy Cathleen E
Home Financials for this Owner
Home Financials are based on the most recent Mortgage that was taken out on this home.
Original Mortgage
$134,300
Interest Rate
8.27%
Purchase Details
Closed on
Mar 5, 1997
Sold by
Craig Roger A
Bought by
Boskovich Stanley J and Boskovich Kathryn A
Home Financials for this Owner
Home Financials are based on the most recent Mortgage that was taken out on this home.
Original Mortgage
$115,600
Interest Rate
8.75%
Mortgage Type
New Conventional
Purchase Details
Closed on
May 1, 1992
Purchase Details
Closed on
Feb 13, 1992
Create a Home Valuation Report for This Property
The Home Valuation Report is an in-depth analysis detailing your home's value as well as a comparison with similar homes in the area
Home Values in the Area
Average Home Value in this Area
Purchase History
| Date | Buyer | Sale Price | Title Company |
|---|---|---|---|
| Thieman Celeste M | -- | Stewart Tit | |
| Healy Robert L | $167,900 | Franklin Abstract | |
| Boskovich Stanley J | $144,500 | -- | |
| -- | $128,400 | -- | |
| -- | $27,500 | -- |
Source: Public Records
Mortgage History
| Date | Status | Borrower | Loan Amount |
|---|---|---|---|
| Previous Owner | Healy Robert L | $134,300 | |
| Previous Owner | Boskovich Stanley J | $115,600 |
Source: Public Records
Tax History Compared to Growth
Tax History
| Year | Tax Paid | Tax Assessment Tax Assessment Total Assessment is a certain percentage of the fair market value that is determined by local assessors to be the total taxable value of land and additions on the property. | Land | Improvement |
|---|---|---|---|---|
| 2024 | $8,089 | $120,760 | $33,990 | $86,770 |
| 2023 | $6,586 | $120,760 | $33,990 | $86,770 |
| 2022 | $6,251 | $91,210 | $15,610 | $75,600 |
| 2021 | $6,247 | $91,210 | $15,610 | $75,600 |
| 2020 | $6,231 | $91,210 | $15,610 | $75,600 |
| 2019 | $5,793 | $72,170 | $12,460 | $59,710 |
| 2018 | $5,539 | $72,170 | $12,460 | $59,710 |
| 2017 | $5,772 | $72,170 | $12,460 | $59,710 |
| 2016 | $5,619 | $65,040 | $13,410 | $51,630 |
| 2015 | $5,306 | $65,040 | $13,410 | $51,630 |
| 2014 | $5,316 | $65,040 | $13,410 | $51,630 |
| 2013 | $2,570 | $61,950 | $12,775 | $49,175 |
Source: Public Records
Map
Nearby Homes
- 5686 Moonpenny Ln
- 2886 Wynneleaf St
- 2880 Wynneleaf St
- 5606 Oldwynne Rd
- 2755 Rustling Oak Blvd
- 5570 Oldwynne Rd
- 2618 Copperwood Rd
- 5488 Whispering Oak Blvd
- 2654 Brittany Oaks Blvd
- 2650 Brittany Oaks Blvd
- 5459 Red Wynne Ln
- 2735 Quailview Ln
- 2625 Rustling Oak Blvd
- 5851 Dena Dr
- 2657 Village Pier Ln Unit 2657
- 5341 Hyde Park Dr
- 2491 Pressman Dr
- 2817 Westrock Dr
- 3127 Stouenburgh Dr
- 6056 Glade Run Rd
- 5705 Moonpenny Ln
- 5687 Moonpenny Ln
- 2835 Bohlen Dr
- 5715 Moonpenny Ln
- 5720 Beechwood Ct
- 5694 Moonpenny Ln
- 2825 Bohlen Dr
- 5704 Moonpenny Ln
- 5723 Moonpenny Ln
- 5712 Moonpenny Ln
- 5710 Beechwood Ct
- 2834 Honeysuckle Ln
- 2846 Bohlen Dr
- 2817 Bohlen Dr
- 5661 Seapine Rd
- 2834 Bohlen Dr
- 5722 Moonpenny Ln
- 2875 Bohlen Dr
- 5695 Elm Grove Ct
- 2824 Bohlen Dr