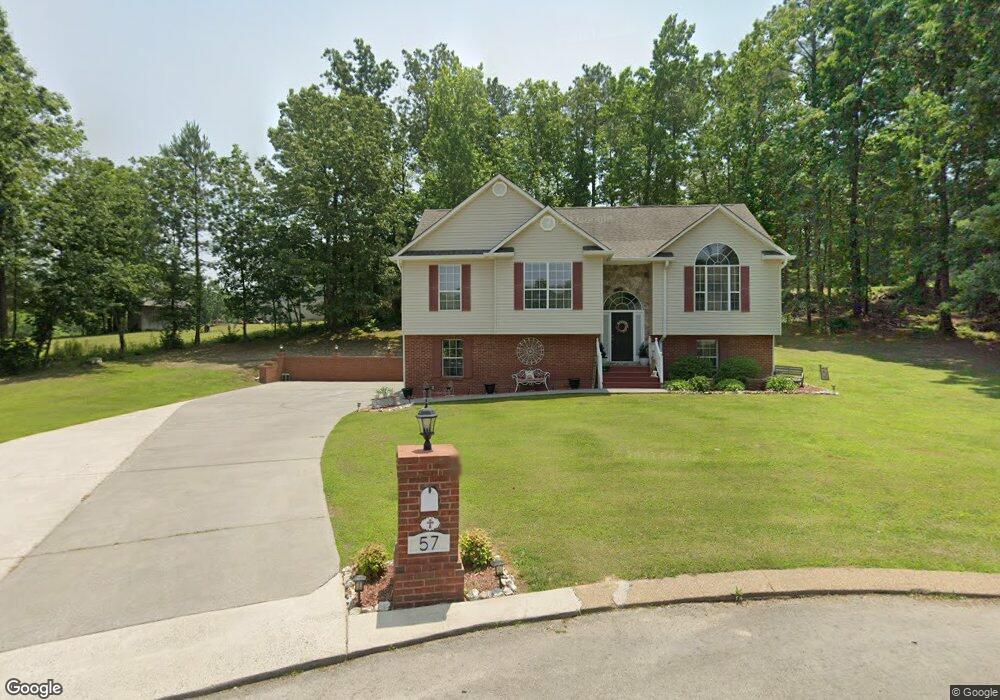
57 Boseman Ln Chickamauga, GA 30707
Estimated Value: $224,000 - $339,000
3
Beds
2
Baths
1,680
Sq Ft
$169/Sq Ft
Est. Value
About This Home
This home is located at 57 Boseman Ln, Chickamauga, GA 30707 and is currently estimated at $283,588, approximately $168 per square foot. 57 Boseman Ln is a home located in Walker County with nearby schools including Cherokee Ridge Elementary School, Chattanooga Valley Middle School, and Ridgeland High School.
Ownership History
Date
Name
Owned For
Owner Type
Purchase Details
Closed on
Jul 19, 2001
Sold by
Caldwell Scott A and Caldwell Susan S
Bought by
Terrell Randall S
Current Estimated Value
Purchase Details
Closed on
Mar 25, 1998
Sold by
Russell Emerson E
Bought by
Caldwell Scott A and Caldwell Susan S
Purchase Details
Closed on
Sep 2, 1997
Sold by
Wallin Ralph D
Bought by
Russell Emerson E
Purchase Details
Closed on
Aug 5, 1994
Sold by
Jenkins James E and Jenkins Gloria
Bought by
Wallin Ralph D
Purchase Details
Closed on
Sep 1, 1993
Sold by
Reliance Mortgage & Realty Co
Bought by
Jenkins James E and Jenkins Gloria
Purchase Details
Closed on
Jul 24, 1975
Sold by
Mcdaniel Joseph
Bought by
Reliance Mortgage & Realty Co
Purchase Details
Closed on
Jul 20, 1971
Bought by
Mcdaniel Joseph
Create a Home Valuation Report for This Property
The Home Valuation Report is an in-depth analysis detailing your home's value as well as a comparison with similar homes in the area
Home Values in the Area
Average Home Value in this Area
Purchase History
| Date | Buyer | Sale Price | Title Company |
|---|---|---|---|
| Terrell Randall S | $121,000 | -- | |
| Caldwell Scott A | $99,900 | -- | |
| Russell Emerson E | -- | -- | |
| Wallin Ralph D | -- | -- | |
| Jenkins James E | $1,000 | -- | |
| Reliance Mortgage & Realty Co | -- | -- | |
| Mcdaniel Joseph | -- | -- |
Source: Public Records
Tax History Compared to Growth
Tax History
| Year | Tax Paid | Tax Assessment Tax Assessment Total Assessment is a certain percentage of the fair market value that is determined by local assessors to be the total taxable value of land and additions on the property. | Land | Improvement |
|---|---|---|---|---|
| 2024 | $2,177 | $97,749 | $10,000 | $87,749 |
| 2023 | $2,118 | $92,944 | $10,000 | $82,944 |
| 2022 | $2,011 | $80,655 | $10,000 | $70,655 |
| 2021 | $1,578 | $56,019 | $6,000 | $50,019 |
| 2020 | $1,385 | $46,770 | $6,000 | $40,770 |
| 2019 | $1,409 | $46,770 | $6,000 | $40,770 |
| 2018 | $1,238 | $46,770 | $6,000 | $40,770 |
| 2017 | $1,717 | $52,770 | $12,000 | $40,770 |
| 2016 | $1,421 | $52,770 | $12,000 | $40,770 |
| 2015 | $1,314 | $45,447 | $7,200 | $38,247 |
| 2014 | $1,212 | $45,447 | $7,200 | $38,247 |
| 2013 | -- | $45,447 | $7,200 | $38,247 |
Source: Public Records
Map
Nearby Homes
- 191 Haleys Cove Dr
- 1208 Johnson Rd
- 70 Brogdon Dr
- 923 Crest Dr
- 932 Johnson Rd
- 374 Wildewood Trail
- 633 E Garden Farm Rd
- 60 Blue Bird Spur
- 544 Lail Rd
- 61 Vista Dr
- 157 W Lewis St
- 946 Greenhill Dr
- 1343 N Highway 341
- 0 Lot 1 Mission Ridge Rd
- 0 Lot 2 Mission Ridge Rd
- 545 E Garden Farm Rd
- 74 Lail Rd
- 1901 Eric Dr
- 535 E Garden Farm Rd
- 201 Laurelwood Cir
- 194 N Forest Rd
- 45 Boseman Ln
- 39 Boseman Ln
- 30 Boseman Ln
- 274 N Forest Rd
- 309 N Forest Rd
- 172 N Forest Rd
- 185 N Forest Rd
- 14 Boseman Ln
- 172 Haleys Cove Dr
- 266 Haleys Cove Dr
- 266 Haleys Cove Dr Unit 18
- 298 S Forest Rd
- 285 S Forest Rd
- 86 Haleys Cove Dr
- 172 Haley's Cove Dr
- 171 N Forest Rd
- 267 Haley's Cove Dr
- 86 Haley''S Cove Dr
- 267 Haleys Cove Dr