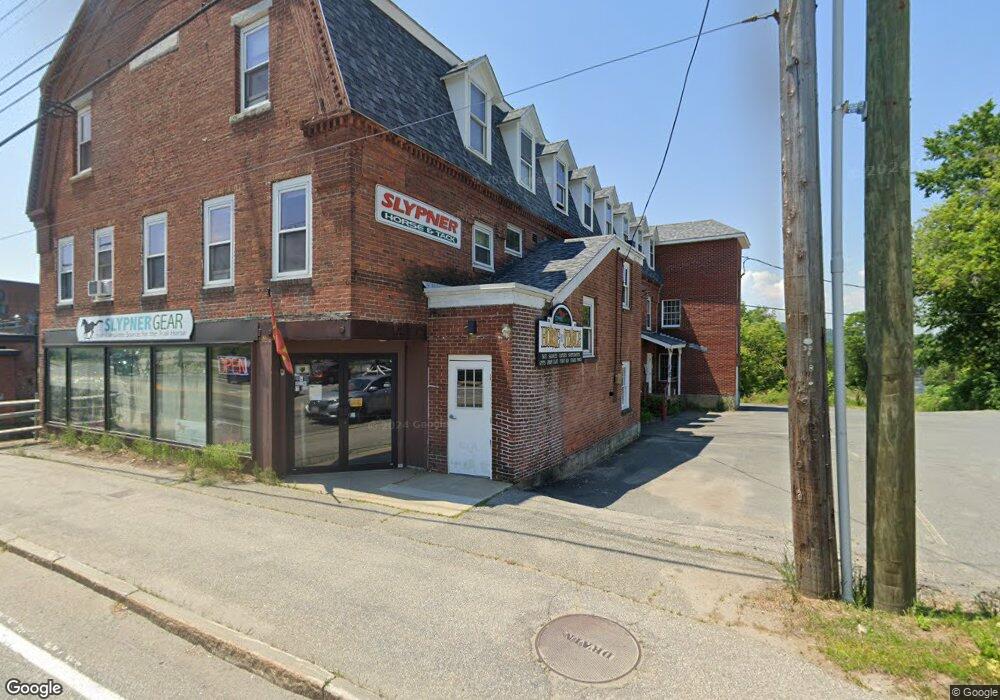
57 Broad St Claremont, NH 03743
North End NeighborhoodEstimated Value: $738,940
--
Bed
--
Bath
9,306
Sq Ft
$79/Sq Ft
Est. Value
About This Home
This home is located at 57 Broad St, Claremont, NH 03743 and is currently estimated at $738,940, approximately $79 per square foot. 57 Broad St is a home located in Sullivan County with nearby schools including Disnard Elementary School, Claremont Middle School, and Stevens High School.
Ownership History
Date
Name
Owned For
Owner Type
Purchase Details
Closed on
Apr 14, 2025
Sold by
Atlantic Natl Hldg Llc
Bought by
57 Broad St Llc
Current Estimated Value
Home Financials for this Owner
Home Financials are based on the most recent Mortgage that was taken out on this home.
Original Mortgage
$564,000
Outstanding Balance
$561,549
Interest Rate
6.76%
Mortgage Type
Purchase Money Mortgage
Estimated Equity
$177,391
Purchase Details
Closed on
Feb 13, 2003
Sold by
Jmc Rt
Bought by
Atlantic Holdings Llc
Create a Home Valuation Report for This Property
The Home Valuation Report is an in-depth analysis detailing your home's value as well as a comparison with similar homes in the area
Home Values in the Area
Average Home Value in this Area
Purchase History
| Date | Buyer | Sale Price | Title Company |
|---|---|---|---|
| 57 Broad St Llc | $705,000 | None Available | |
| 57 Broad St Llc | $705,000 | None Available | |
| Atlantic Holdings Llc | $130,000 | -- | |
| Atlantic Holdings Llc | $130,000 | -- |
Source: Public Records
Mortgage History
| Date | Status | Borrower | Loan Amount |
|---|---|---|---|
| Open | 57 Broad St Llc | $564,000 | |
| Closed | 57 Broad St Llc | $564,000 | |
| Previous Owner | Atlantic Holdings Llc | $126,000 |
Source: Public Records
Tax History Compared to Growth
Tax History
| Year | Tax Paid | Tax Assessment Tax Assessment Total Assessment is a certain percentage of the fair market value that is determined by local assessors to be the total taxable value of land and additions on the property. | Land | Improvement |
|---|---|---|---|---|
| 2024 | $14,773 | $504,900 | $136,800 | $368,100 |
| 2023 | $14,036 | $504,900 | $136,800 | $368,100 |
| 2022 | $13,183 | $316,300 | $70,400 | $245,900 |
| 2021 | $12,962 | $316,300 | $70,400 | $245,900 |
| 2020 | $12,880 | $316,300 | $70,400 | $245,900 |
| 2019 | $12,734 | $316,300 | $70,400 | $245,900 |
| 2018 | $10,179 | $241,900 | $70,400 | $171,500 |
| 2017 | $10,319 | $241,900 | $70,400 | $171,500 |
| 2016 | $10,310 | $241,900 | $70,400 | $171,500 |
| 2015 | $10,032 | $241,900 | $70,400 | $171,500 |
| 2014 | $9,998 | $241,900 | $70,400 | $171,500 |
| 2013 | $10,121 | $279,200 | $75,600 | $203,600 |
Source: Public Records
Map
Nearby Homes
- 11 Water St
- 2 Meadow St
- 00 Washington St
- 13 Water St
- 12 Meadow St
- 12 Meadow St
- 8 Wall St
- 2-6 Tremont
- 26 Tremont St Unit 2
- 12 Wall St
- 6 Tremont St
- 42 Opera House Square
- 35 Crescent St
- 11 Wall St
- 13 Meadow St
- 36-38 Opera House Square
- 42 Opera House Square
- 21 Wall St
- 16-34 Opera House Square
- 16 Opera House Square