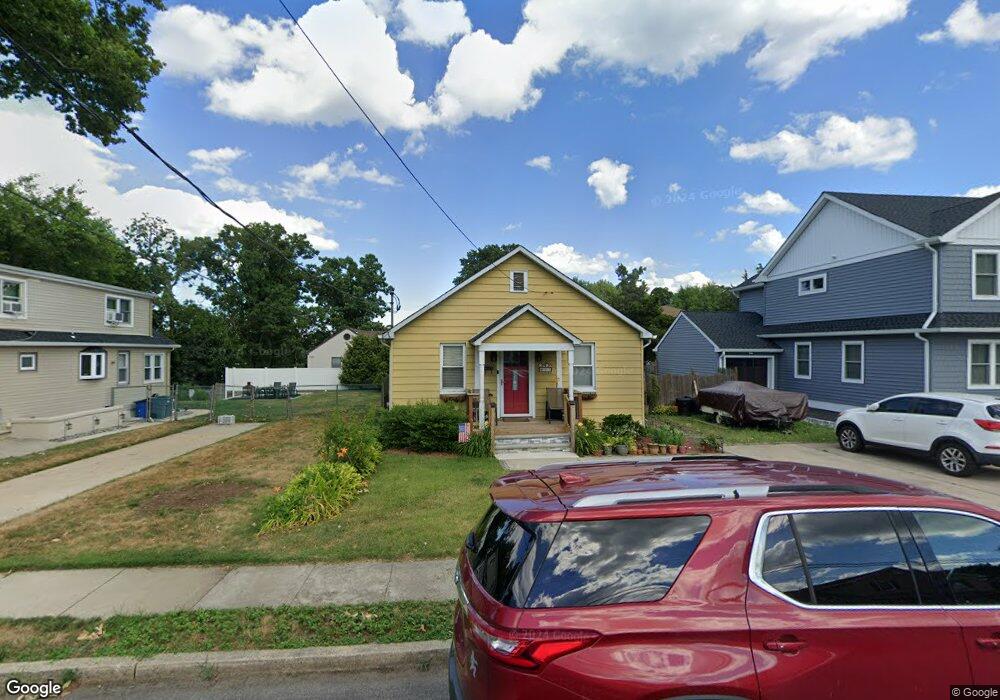
57 Chingarora Ave Keyport, NJ 07735
Estimated Value: $375,000 - $430,000
2
Beds
1
Bath
864
Sq Ft
$467/Sq Ft
Est. Value
About This Home
This home is located at 57 Chingarora Ave, Keyport, NJ 07735 and is currently estimated at $403,302, approximately $466 per square foot. 57 Chingarora Ave is a home located in Monmouth County with nearby schools including Keyport Central School, Keyport High School, and Icob Academy.
Ownership History
Date
Name
Owned For
Owner Type
Purchase Details
Closed on
Sep 12, 2003
Sold by
Buda Thomas
Bought by
Flynn Denise
Current Estimated Value
Home Financials for this Owner
Home Financials are based on the most recent Mortgage that was taken out on this home.
Original Mortgage
$160,000
Interest Rate
6.05%
Purchase Details
Closed on
Apr 18, 1996
Sold by
Piasecki Janice
Bought by
Buda Thomas and Buda Hillary
Home Financials for this Owner
Home Financials are based on the most recent Mortgage that was taken out on this home.
Original Mortgage
$76,000
Interest Rate
7.34%
Create a Home Valuation Report for This Property
The Home Valuation Report is an in-depth analysis detailing your home's value as well as a comparison with similar homes in the area
Home Values in the Area
Average Home Value in this Area
Purchase History
| Date | Buyer | Sale Price | Title Company |
|---|---|---|---|
| Flynn Denise | $215,000 | -- | |
| Buda Thomas | $95,000 | -- |
Source: Public Records
Mortgage History
| Date | Status | Borrower | Loan Amount |
|---|---|---|---|
| Previous Owner | Flynn Denise | $160,000 | |
| Previous Owner | Buda Thomas | $76,000 |
Source: Public Records
Tax History Compared to Growth
Tax History
| Year | Tax Paid | Tax Assessment Tax Assessment Total Assessment is a certain percentage of the fair market value that is determined by local assessors to be the total taxable value of land and additions on the property. | Land | Improvement |
|---|---|---|---|---|
| 2025 | $6,891 | $369,000 | $221,100 | $147,900 |
| 2024 | $6,759 | $332,900 | $192,300 | $140,600 |
| 2023 | $6,759 | $307,500 | $174,800 | $132,700 |
| 2022 | $5,294 | $267,400 | $152,000 | $115,400 |
| 2021 | $5,294 | $227,100 | $140,800 | $86,300 |
| 2020 | $5,528 | $217,400 | $135,300 | $82,100 |
| 2019 | $5,337 | $210,200 | $130,000 | $80,200 |
| 2018 | $5,330 | $205,000 | $130,000 | $75,000 |
| 2017 | $5,191 | $199,100 | $125,000 | $74,100 |
| 2016 | $5,038 | $194,900 | $125,000 | $69,900 |
| 2015 | $4,649 | $179,000 | $110,000 | $69,000 |
| 2014 | $3,981 | $154,800 | $85,000 | $69,800 |
Source: Public Records
Map
Nearby Homes
- 8 Chingarora Ave
- 95 Broadway
- 127 Chingarora Ave
- 253 Broadway
- 1 Hobart St
- 52 Highway 35
- 324 Maple Place
- 9 Monmouth Place
- 22 Lower Main St
- 90 Saint Peters Place
- 369 Riverdale Dr
- 226 Osborn St
- 40 Church St
- 55 E Front St
- 557 Lloyd Rd Unit B
- 195 Atlantic St
- 231 Atlantic St Unit 23
- 47 Village Green Way
- 25-27 Brook Ave
- 128 1st St
- 59 Chingarora Ave
- 53 Chingarora Ave
- 94 Luppatatong Ave
- 98 Luppatatong Ave
- 61 Chingarora Ave
- 51 Chingarora Ave
- 56 Chingarora Ave
- 58 Chingarora Ave
- 54 Chingarora Ave
- 30 W 2 St
- 30 W 2nd St
- 85 Chingarora Ave
- 50 Chingarora Ave
- 102 Luppatatong Ave
- 165 Broadway
- 147 Broadway
- 149 Broadway Unit 151
- 87 Chingarora Ave
- 41 Chingarora Ave
- 169 Broadway