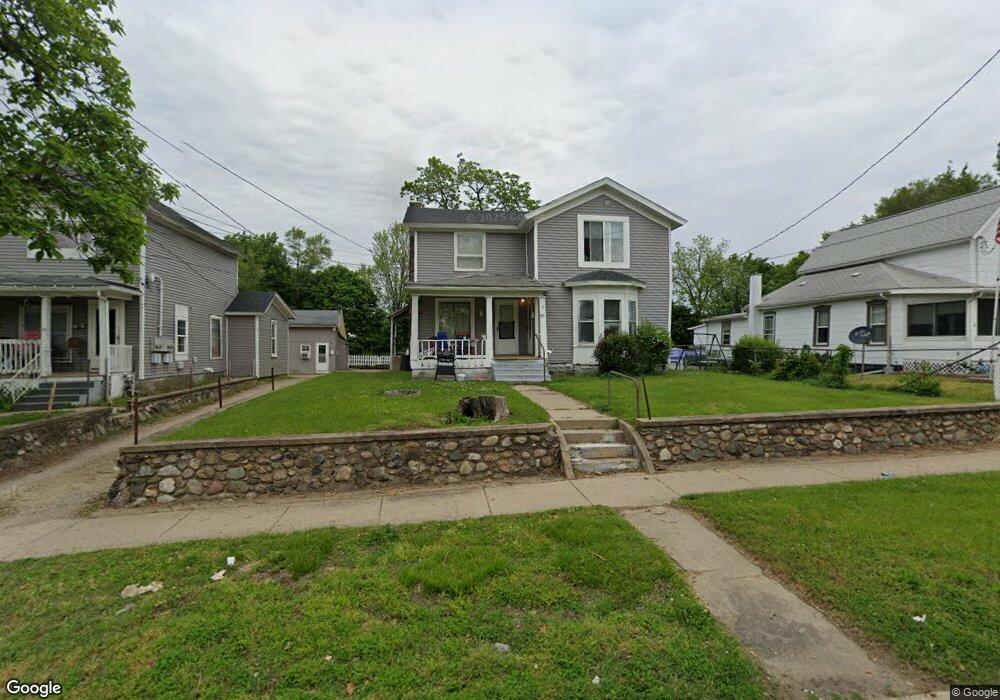
57 Cliff St Battle Creek, MI 49014
Post Franklin NeighborhoodEstimated Value: $92,000 - $118,877
4
Beds
5
Baths
1,896
Sq Ft
$53/Sq Ft
Est. Value
About This Home
This home is located at 57 Cliff St, Battle Creek, MI 49014 and is currently estimated at $100,219, approximately $52 per square foot. 57 Cliff St is a home located in Calhoun County with nearby schools including Post-Franklin Elementary School, Springfield Middle School, and Battle Creek Central High School.
Ownership History
Date
Name
Owned For
Owner Type
Purchase Details
Closed on
Feb 28, 2024
Sold by
River City Homes Llc
Bought by
Green Tide Llc
Current Estimated Value
Home Financials for this Owner
Home Financials are based on the most recent Mortgage that was taken out on this home.
Original Mortgage
$280,000
Outstanding Balance
$275,316
Interest Rate
6.6%
Mortgage Type
New Conventional
Estimated Equity
-$175,097
Purchase Details
Closed on
Sep 10, 2021
Sold by
Embury Daniel E
Bought by
River City Homes Llc
Purchase Details
Closed on
Feb 28, 1998
Sold by
Embury Dayna A
Bought by
Embury Daniel E
Purchase Details
Closed on
Feb 27, 1998
Sold by
Embury Wendell and Anita
Bought by
Embury Daniel E and Embury Dayna A
Purchase Details
Closed on
Jan 20, 1995
Sold by
Embury Wendellp and Embury Anita L
Bought by
Embury Daniel E and Embury Dayna A
Create a Home Valuation Report for This Property
The Home Valuation Report is an in-depth analysis detailing your home's value as well as a comparison with similar homes in the area
Home Values in the Area
Average Home Value in this Area
Purchase History
| Date | Buyer | Sale Price | Title Company |
|---|---|---|---|
| Green Tide Llc | $225,000 | First American Title | |
| River City Homes Llc | $145,000 | Ata National Title Group Llc | |
| Embury Daniel E | -- | -- | |
| Embury Daniel E | $17,500 | -- | |
| Embury Daniel E | $35,000 | -- |
Source: Public Records
Mortgage History
| Date | Status | Borrower | Loan Amount |
|---|---|---|---|
| Open | Green Tide Llc | $280,000 |
Source: Public Records
Tax History Compared to Growth
Tax History
| Year | Tax Paid | Tax Assessment Tax Assessment Total Assessment is a certain percentage of the fair market value that is determined by local assessors to be the total taxable value of land and additions on the property. | Land | Improvement |
|---|---|---|---|---|
| 2025 | -- | $45,600 | $0 | $0 |
| 2024 | $2,041 | $47,743 | $0 | $0 |
| 2023 | $2,596 | $48,213 | $0 | $0 |
| 2022 | $1,844 | $39,268 | $0 | $0 |
| 2021 | $1,071 | $28,310 | $0 | $0 |
| 2020 | $1,009 | $21,138 | $0 | $0 |
| 2019 | $1,003 | $21,567 | $0 | $0 |
| 2018 | $1,003 | $20,133 | $662 | $19,471 |
| 2017 | $976 | $30,000 | $0 | $0 |
| 2016 | $974 | $30,000 | $0 | $0 |
| 2015 | $955 | $24,797 | $3,766 | $21,031 |
| 2014 | $955 | $24,797 | $3,766 | $21,031 |
Source: Public Records
Map
Nearby Homes